Page 423 - Fair, Geyer, and Okun's Water and wastewater engineering : water supply and wastewater removal
P. 423

JWCL344_ch11_357-397.qxd  8/2/10  9:01 PM  Page 383


                                                                       11.15 Intensity-Duration-Frequency Relationships  383
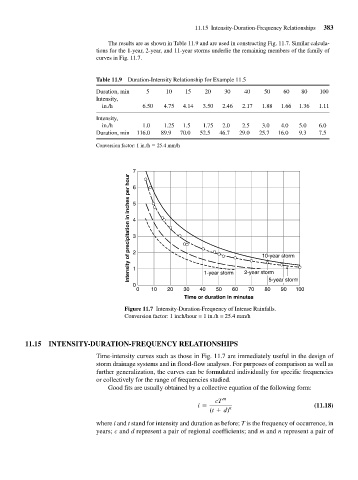
                                             The results are as shown in Table 11.9 and are used in constructing Fig. 11.7. Similar calcula-
                                         tions for the 1-year, 2-year, and 11-year storms underlie the remaining members of the family of
                                         curves in Fig. 11.7.


                                         Table 11.9  Duration-Intensity Relationship for Example 11.5

                                         Duration, min   5     10   15    20    30    40    50    60    80   100
                                         Intensity,
                                           in./h        6.50  4.75  4.14  3.50  2.46  2.17  1.88  1.66  1.36  1.11

                                         Intensity,
                                           in./h        1.0   1.25  1.5   1.75  2.0   2.5   3.0   4.0  5.0   6.0
                                         Duration, min  116.0  89.9  70.0  52.5  46.7  29.0  25.7  16.0  9.3  7.5
                                         Conversion factor: 1 in./h   25.4 mm/h


                                                     7
                                                   Intensity of precipitation in inches per hour  5  10-year storm
                                                     6


                                                     4

                                                     3

                                                     2

                                                     1
                                                                                              5-year storm
                                                     0                    1-year storm  2-year storm
                                                      0   10   20   30   40   50   60   70   80   90  100
                                                                    Time or duration in minutes
                                                  Figure 11.7 Intensity-Duration-Frequency of Intense Rainfalls.
                                                  Conversion factor: 1 inch/hour = 1 in./h = 25.4 mm/h


                    11.15  INTENSITY-DURATION-FREQUENCY RELATIONSHIPS

                                         Time-intensity curves such as those in Fig. 11.7 are immediately useful in the design of
                                         storm drainage systems and in flood-flow analyses. For purposes of comparison as well as
                                         further generalization, the curves can be formulated individually for specific frequencies
                                         or collectively for the range of frequencies studied.
                                             Good fits are usually obtained by a collective equation of the following form:
                                                                              cT m
                                                                        i =       n                         (11.18)
                                                                            (t + d)
                                         where i and t stand for intensity and duration as before; T is the frequency of occurrence, in
                                         years; c and d represent a pair of regional coefficients; and m and n represent a pair of
   418   419   420   421   422   423   424   425   426   427   428