
Page 425 - Fair, Geyer, and Okun's Water and wastewater engineering : water supply and wastewater removal
P. 425
JWCL344_ch11_357-397.qxd 8/2/10 9:01 PM Page 385
11.15 Intensity-Duration-Frequency Relationships 385
30
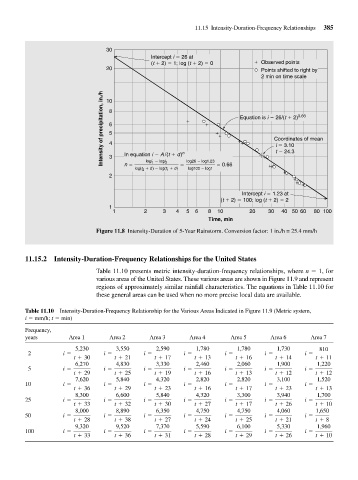
Intercept i 26 at
(t 2) 1; log (t 2) 0 Observed points
20 Points shifted to right by
2 min on time scale
Intensity of precipitation, in./h 8 Equation is i 26/(t 2) 0.66
10
6
5
Coordinates of mean
4
i 3.10
In equation i A /(t d)
3
1
logi logi 2
n
log(t d ) log(t 1 d ) n log26 log1.23 0.66 t 24.3
log100 log1
2
2
Intercept i 1.23 at
(t 2) 100; log (t 2) 2
1
1 2 3 4 5 6 8 10 20 30 40 50 60 80 100
Time, min
Figure 11.8 Intensity-Duration of 5-Year Rainstorm. Conversion factor: 1 in./h = 25.4 mm/h
11.15.2 Intensity-Duration-Frequency Relationships for the United States
Table 11.10 presents metric intensity-duration-frequency relationships, where n 1, for
various areas of the United States. These various areas are shown in Figure 11.9 and represent
regions of approximately similar rainfall characteristics. The equations in Table 11.10 for
these general areas can be used when no more precise local data are available.
Table 11.10 Intensity-Duration-Frequency Relationship for the Various Areas Indicated in Figure 11.9 (Metric system,
i mm/h; t min)
Frequency,
years Area 1 Area 2 Area 3 Area 4 Area 5 Area 6 Area 7
5,230 3,550 2,590 1,780 1,780 1,730 810
2 i = i = i = i = i = i = i =
t + 30 t + 21 t + 17 t + 13 t + 16 t + 14 t + 11
6,270 4,830 3,330 2,460 2,060 1,900 1,220
5 i = i = i = i = i = i = i =
t + 29 t + 25 t + 19 t + 16 t + 13 t + 12 t + 12
7,620 5,840 4,320 2,820 2,820 3,100 1,520
10 i = i = i = i = i = i = i =
t + 36 t + 29 t + 23 t + 16 t + 17 t + 23 t + 13
8,300 6,600 5,840 4,320 3,300 3,940 1,700
25 i = i = i = i = i = i = i =
t + 33 t + 32 t + 30 t + 27 t + 17 t + 26 t + 10
8,000 8,890 6,350 4,750 4,750 4,060 1,650
50 i = i = i = i = i = i = i =
t + 28 t + 38 t + 27 t + 24 t + 25 t + 21 t + 8
9,320 9,520 7,370 5,590 6,100 5,330 1,960
100 i = i = i = i = i = i = i =
t + 33 t + 36 t + 31 t + 28 t + 29 t + 26 t + 10