
Page 429 - Fair, Geyer, and Okun's Water and wastewater engineering : water supply and wastewater removal
P. 429
JWCL344_ch11_357-397.qxd 8/2/10 9:01 PM Page 389
11.17 Estimates of Storm Runoff 389
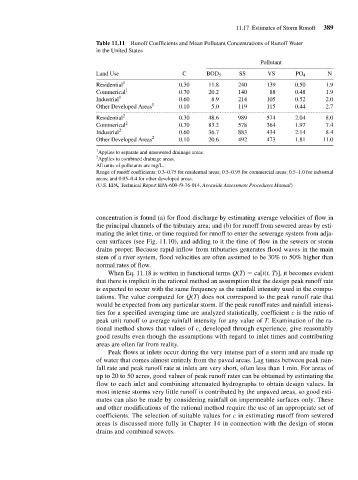
Table 11.11 Runoff Coefficients and Mean Pollutant Concentrations of Runoff Water
in the United States
Pollutant
Land Use C BOD 5 SS VS PO 4 N
Residential 1 0.30 11.8 240 139 0.50 1.9
Commerical 1 0.70 20.2 140 88 0.48 1.9
Industrial 1 0.60 8.9 214 105 0.52 2.0
Other Developed Areas 1 0.10 5.0 119 115 0.44 2.7
Residential 2 0.30 48.6 989 574 2.04 8.0
Commerical 2 0.70 83.2 578 364 1.97 7.4
Industrial 2 0.60 36.7 883 434 2.14 8.4
Other Developed Areas 2 0.10 20.6 492 473 1.81 11.0
1
Applies to separate and unsewered drainage areas.
2
Applies to combined drainage areas.
All units of pollutants are mg/L.
Range of runoff coefficients: 0.3–0.75 for residential areas; 0.5–0.95 for commercial areas; 0.5–1.0 for industrial
areas; and 0.05–0.4 for other developed areas.
(U.S. EPA, Technical Report EPA-600-/9-76-014, Areawide Assessment Procedures Manual)
concentration is found (a) for flood discharge by estimating average velocities of flow in
the principal channels of the tributary area; and (b) for runoff from sewered areas by esti-
mating the inlet time, or time required for runoff to enter the sewerage system from adja-
cent surfaces (see Fig. 11.10), and adding to it the time of flow in the sewers or storm
drains proper. Because rapid inflow from tributaries generates flood waves in the main
stem of a river system, flood velocities are often assumed to be 30% to 50% higher than
normal rates of flow.
When Eq. 11.18 is written in functional terms Q(T) ca[i(t, T)], it becomes evident
that there is implicit in the rational method an assumption that the design peak runoff rate
is expected to occur with the same frequency as the rainfall intensity used in the compu-
tations. The value computed for Q(T) does not correspond to the peak runoff rate that
would be expected from any particular storm. If the peak runoff rates and rainfall intensi-
ties for a specified averaging time are analyzed statistically, coefficient c is the ratio of
peak unit runoff to average rainfall intensity for any value of T. Examination of the ra-
tional method shows that values of c, developed through experience, give reasonably
good results even though the assumptions with regard to inlet times and contributing
areas are often far from reality.
Peak flows at inlets occur during the very intense part of a storm and are made up
of water that comes almost entirely from the paved areas. Lag times between peak rain-
fall rate and peak runoff rate at inlets are very short, often less than 1 min. For areas of
up to 20 to 50 acres, good values of peak runoff rates can be obtained by estimating the
flow to each inlet and combining attenuated hydrographs to obtain design values. In
most intense storms very little runoff is contributed by the unpaved areas, so good esti-
mates can also be made by considering rainfall on impermeable surfaces only. These
and other modifications of the rational method require the use of an appropriate set of
coefficients. The selection of suitable values for c in estimating runoff from sewered
areas is discussed more fully in Chapter 14 in connection with the design of storm
drains and combined sewers.