Page 433 - Fair, Geyer, and Okun's Water and wastewater engineering : water supply and wastewater removal
P. 433

JWCL344_ch11_357-397.qxd  8/2/10  9:01 PM  Page 393


                                                                                    11.17 Estimates of Storm Runoff  393
                                             The unit-hydrograph method is useful in estimating magnitudes of unusual flood
                                         flows, in forecasting flood crests during storms, and in the manipulation of storage on large
                                         river systems. It has the important property of (a) tracing the full hydrograph resulting
                                         from a storm rather than being confined to a determination of the peak flow alone, and (b)
                                         producing useful results from short records. For small drainage areas, the method depends
                                         on the readings of a recording rain gauge.


                     EXAMPLE 11.10  APPLICATION OF UNIT HYDROGRAPH METHOD
                                                                                               2
                                             1. Given the rainfall and runoff records of a drainage area of 620 mi , determine the general-
                                                ized distribution of runoff (the distribution graph) from isolated unit-time rainfalls.
                                             2. Apply the average estimate of runoff distribution to the observed rainfall sequence ob-
                                                tained above.

                                         Solution:
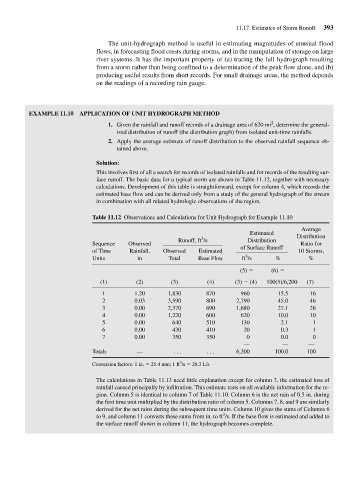
                                         This involves first of all a search for records of isolated rainfalls and for records of the resulting sur-
                                         face runoff. The basic data for a typical storm are shown in Table 11.12, together with necessary
                                         calculations. Development of this table is straightforward, except for column 4, which records the
                                         estimated base flow and can be derived only from a study of the general hydrograph of the stream
                                         in combination with all related hydrologic observations of the region.


                                        Table 11.12 Observations and Calculations for Unit Hydrograph for Example 11.10
                                                                                                        Average
                                                                                        Estimated     Distribution
                                                                         3
                                                                  Runoff, ft /s        Distribution
                                        Sequence   Observed                                            Ratio for
                                        of Time     Rainfall,  Observed  Estimated   of Surface Runoff  10 Storms,
                                                                                       3
                                        Units         in       Total    Base Flow     ft /s     %         %
                                                                                     (5)       (6)
                                           (1)        (2)       (3)        (4)      (3)   (4)  100(5)/6,200  (7)
                                           1         1.20      1,830       870       960         15.5     16
                                           2         0.03      3,590       800      2,790        45.0     46
                                           3         0.00      2,370       690      1,680        27.1     26
                                           4         0.00      1,220       600       620         10.0     10
                                           5         0.00        640       510       130          2.1      1
                                           6         0.00        430       410        20          0.3      1
                                           7         0.00        350       350         0          0.0      0
                                                                                      —           —       —
                                        Totals        —          . . .     . . .    6,200       100.0    100
                                                                   3
                                        Conversion factors: 1 in.   25.4 mm; 1 ft /s   28.3 L/s
                                         The calculations in Table 11.13 need little explanation except for column 3, the estimated loss of
                                         rainfall caused principally by infiltration. This estimate rests on all available information for the re-
                                         gion. Column 5 is identical to column 7 of Table 11.10. Column 6 is the net rain of 0.5 in. during
                                         the first time unit multiplied by the distribution ratio of column 5. Columns 7, 8, and 9 are similarly
                                         derived for the net rains during the subsequent time units. Column 10 gives the sums of Columns 6
                                                                                3
                                         to 9, and column 11 converts these sums from in. to ft /s. If the base flow is estimated and added to
                                         the surface runoff shown in column 11, the hydrograph becomes complete.
   428   429   430   431   432   433   434   435   436   437   438