
Page 434 - Fair, Geyer, and Okun's Water and wastewater engineering : water supply and wastewater removal
P. 434
JWCL344_ch11_357-397.qxd 8/2/10 9:01 PM Page 394
394 Chapter 11 Hydrology: Rainfall and Runoff
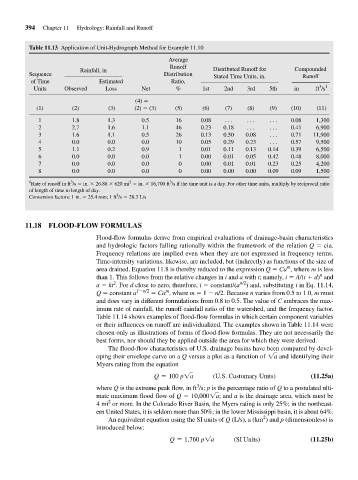
Table 11.13 Application of Unit-Hydrograph Method for Example 11.10
Average
Runoff
Rainfall, in Distributed Runoff for Compounded
Sequence Distribution
Stated Time Units, in. Runoff
of Time Estimated Ratio,
3 1
Units Observed Loss Net % 1st 2nd 3rd 5th in ft /s
(4)
(1) (2) (3) (2) (3) (5) (6) (7) (8) (9) (10) (11)
1 1.8 1.3 0.5 16 0.08 . . . . . . . . . 0.08 1,300
2 2.7 1.6 1.1 46 0.23 0.18 . . . . . . 0.41 6,900
3 1.6 1.1 0.5 26 0.13 0.50 0.08 . . . 0.71 11,900
4 0.0 0.0 0.0 10 0.05 0.29 0.23 . . . 0.57 9,500
5 1.1 0.2 0.9 1 0.01 0.11 0.13 0.14 0.39 6,500
6 0.0 0.0 0.0 1 0.00 0.01 0.05 0.42 0.48 8,000
7 0.0 0.0 0.0 0 0.00 0.01 0.01 0.23 0.25 4,200
8 0.0 0.0 0.0 0 0.00 0.00 0.00 0.09 0.09 1,500
1 3 2 3
Rate of runoff in ft /s in. 26.88 620 mi in. 16,700 ft /s if the time unit is a day. For other time units, multiply by reciprocal ratio
of length of time to length of day.
3
Conversion factors: 1 in. 25.4 mm; 1 ft /s 28.3 L/s
11.18 FLOOD-FLOW FORMULAS
Flood-flow formulas derive from empirical evaluations of drainage-basin characteristics
and hydrologic factors falling rationally within the framework of the relation Q cia.
Frequency relations are implied even when they are not expressed in frequency terms.
Time-intensity variations, likewise, are included, but (indirectly) as functions of the size of
m
area drained. Equation 11.8 is thereby reduced to the expression Q Ca , where m is less
n
than 1. This follows from the relative changes in i and a with t; namely, i A/(t d) and
2
n/2
a kt . For d close to zero, therefore, i constant/(a ) and, substituting i in Eq. 11.14,
m
Q constant a 1 n/2 Ca , where m 1 n/2. Because n varies from 0.5 to 1.0, m must
and does vary in different formulations from 0.8 to 0.5. The value of C embraces the max-
imum rate of rainfall, the runoff-rainfall ratio of the watershed, and the frequency factor.
Table 11.14 shows examples of flood-flow formulas in which certain component variables
or their influences on runoff are individualized. The examples shown in Table 11.14 were
chosen only as illustrations of forms of flood-flow formulas. They are not necessarily the
best forms, nor should they be applied outside the area for which they were derived.
The flood-flow characteristics of U.S. drainage basins have been compared by devel-
oping their envelope curve on a Q versus a plot as a function of 1a and identifying their
Myers rating from the equation
Q = 100 p1a (U.S. Customary Units) (11.25a)
3
where Q is the extreme peak flow, in ft /s; p is the percentage ratio of Q to a postulated ulti-
mate maximum flood flow of Q = 10,0001a; and a is the drainage area, which must be
2
4 mi or more. In the Colorado River Basin, the Myers rating is only 25%; in the northeast-
ern United States, it is seldom more than 50%; in the lower Mississippi basin, it is about 64%.
2
An equivalent equation using the SI units of Q (L/s), a (km ) and p (dimensionless) is
introduced below:
Q = 1,760 p1a (SI Units) (11.25b)