Page 424 - Fair, Geyer, and Okun's Water and wastewater engineering : water supply and wastewater removal
P. 424
JWCL344_ch11_357-397.qxd  8/2/10  9:01 PM  Page 384


                    384  Chapter 11  Hydrology: Rainfall and Runoff
                                         regional exponents. Their order of magnitude is about as follows in North American expe-
                                         rience: c   5 to 50 and d   0 to 30; m   0.1 to 0.5 and n   0.4 to 1.0.
                                             Equation 11.18 can be fitted to a station record either graphically or by least squares.
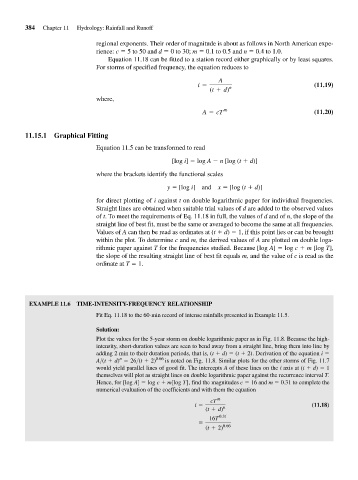
                                          For storms of specified frequency, the equation reduces to

                                                                               A
                                                                        i =       n                         (11.19)
                                                                            (t + d)
                                          where,

                                                                          A = cT m                          (11.20)


                    11.15.1  Graphical Fitting
                                         Equation 11.5 can be transformed to read

                                                                 [log i]   log A   n [log (t 	 d)]
                                          where the brackets identify the functional scales

                                                               y   [log i] and  x   [log (t 	 d)]
                                          for direct plotting of i against t on double logarithmic paper for individual frequencies.
                                          Straight lines are obtained when suitable trial values of d are added to the observed values
                                          of t. To meet the requirements of Eq. 11.18 in full, the values of d and of n, the slope of the
                                          straight line of best fit, must be the same or averaged to become the same at all frequencies.
                                          Values of A can then be read as ordinates at (t 	 d)   1, if this point lies or can be brought
                                          within the plot. To determine c and m, the derived values of A are plotted on double loga-
                                         rithmic paper against T for the frequencies studied. Because [log A]   log c 	 m [log T],
                                         the slope of the resulting straight line of best fit equals m, and the value of c is read as the
                                         ordinate at T   1.


                     EXAMPLE 11.6  TIME-INTENSITY-FREQUENCY RELATIONSHIP
                                         Fit Eq. 11.18 to the 60-min record of intense rainfalls presented in Example 11.5.

                                         Solution:
                                         Plot the values for the 5-year storm on double logarithmic paper as in Fig. 11.8. Because the high-
                                         intensity, short-duration values are seen to bend away from a straight line, bring them into line by
                                         adding 2 min to their duration periods, that is, (t 	 d)   (t 	 2). Derivation of the equation i
                                                 n          0.66
                                          A>(t 	 d)   26>(t 	 2)  is noted on Fig. 11.8. Similar plots for the other storms of Fig. 11.7
                                         would yield parallel lines of good fit. The intercepts A of these lines on the i axis at (t 	 d)   1
                                          themselves will plot as straight lines on double logarithmic paper against the recurrence interval T.
                                          Hence, for [log A]   log c 	 m[log T], find the magnitudes c   16 and m   0.31 to complete the
                                         numerical evaluation of the coefficients and with them the equation
                                                                            cT m
                                                                         i =    n                          (11.18)
                                                                           (t + d)
                                                                               0.31
                                                                            16T
                                                                          =     0.66
                                                                           (t + 2)

