
Page 516 - Fair, Geyer, and Okun's Water and wastewater engineering : water supply and wastewater removal
P. 516
JWCL344_ch13_457-499.qxd 8/7/10 8:49 PM Page 474
474 Chapter 13 Hydraulics of Sewer Systems
13.7 LENGTH OF TRANSITIONS
Transition from one to the other alternate stage carries the flow through the critical depth.
Passage from the upper alternate stage (a) to the critical depth or (b) through it, to the lower
alternate stage or to free fall, produces nonuniform (accelerating) flow and a drawdown
curve in the water surface. Passage from the lower to the upper alternate stage creates the
hydraulic jump. Reduction in velocity of flow, by discharge into relatively quiet water or
by weirs and other flow obstructions, dams up the water and induces nonuniform (deceler-
ating) flow and a backwater curve in the water surface. For economy of design, the size of
conduit must fit conditions of flow within the range of transient depths and nonuniform
flow. If initial and terminal depths of flow are known, the energy and hydraulic grade lines
can be traced either by stepwise calculation or by integration (graphical or analytical).
Both stem from the fact that the change in slope of the energy grade line must equal the
sum of the changes in the slopes of the invert, the depth of flow, and the velocity head.
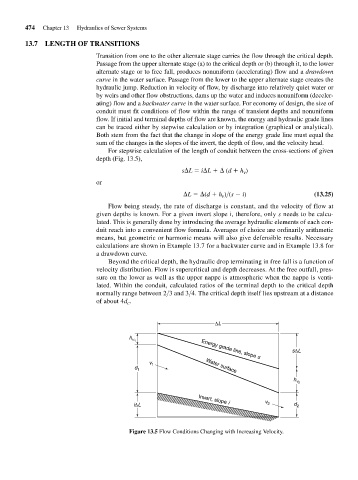
For stepwise calculation of the length of conduit between the cross-sections of given
depth (Fig. 13.5),
s L i L (d h v )
or
L (d h v )>(s i) (13.25)
Flow being steady, the rate of discharge is constant, and the velocity of flow at
given depths is known. For a given invert slope i, therefore, only s needs to be calcu-
lated. This is generally done by introducing the average hydraulic elements of each con-
duit reach into a convenient flow formula. Averages of choice are ordinarily arithmetic
means, but geometric or harmonic means will also give defensible results. Necessary
calculations are shown in Example 13.7 for a backwater curve and in Example 13.8 for
a drawdown curve.
Beyond the critical depth, the hydraulic drop terminating in free fall is a function of
velocity distribution. Flow is supercritical and depth decreases. At the free outfall, pres-
sure on the lower as well as the upper nappe is atmospheric when the nappe is venti-
lated. Within the conduit, calculated ratios of the terminal depth to the critical depth
normally range between 2>3 and 3>4. The critical depth itself lies upstream at a distance
of about 4d c .
ΔL
h
v 1
sΔL
Energy grade line, slope s
v 1
d 1 Water surface
h
v 2
v
Invert, slope i
iΔL 2 d 2
Figure 13.5 Flow Conditions Changing with Increasing Velocity.