Page 518 - Fair, Geyer, and Okun's Water and wastewater engineering : water supply and wastewater removal
P. 518

JWCL344_ch13_457-499.qxd  8/7/10  8:49 PM  Page 476


                    476  Chapter 13  Hydraulics of Sewer Systems


                                             Column 15: Arithmetic mean of successive pairs of values in column 12.
                                                                             2
                                                                                              2/3 2
                                             Column 16: (Column 15/1.49   column 14) , that is, s   (nv>1.49r ) .
                                             Column 17: Column 16   i   Col. 16   50.
                                             Column 18: Difference between successive pairs of values in column 10.
                                                                           5
                                             Column 19: Column 18/column 17   l0 , that is,  l   (d   h v )/(s   i).
                                             Column 20: Cumulative values of column 19.


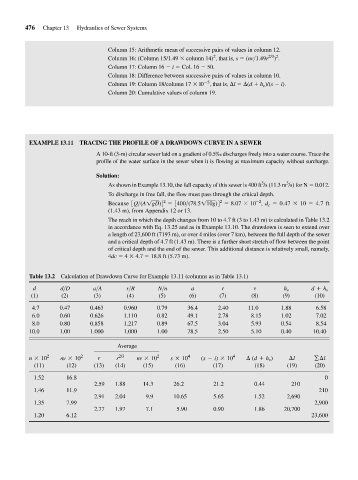
                     EXAMPLE 13.11  TRACING THE PROFILE OF A DRAWDOWN CURVE IN A SEWER

                                         A 10-ft (3-m) circular sewer laid on a gradient of 0.5‰ discharges freely into a water course. Trace the
                                         profile of the water surface in the sewer when it is flowing at maximum capacity without surcharge.

                                         Solution:
                                                                                            3
                                                                                                   3
                                             As shown in Example 13.10, the full capacity of this sewer is 400 ft /s (11.3 m /s) for N   0.012.
                                             To discharge in free fall, the flow must pass through the critical depth.
                                                                                          -2
                                                                               2
                                                              2
                                             Because 3Q>(A1gD)4 = 3400>(78.5110g)4 = 8.07 * 10 ,  d c   0.47   10   4.7 ft
                                             (1.43 m), from Appendix 12 or 13.
                                             The reach in which the depth changes from 10 to 4.7 ft (3 to 1.43 m) is calculated in Table 13.2
                                             in accordance with Eq. 13.25 and as in Example 13.10. The drawdown is seen to extend over
                                             a length of 23,600 ft (7193 m), or over 4 miles (over 7 km), between the full depth of the sewer
                                             and a critical depth of 4.7 ft (1.43 m). There is a further short stretch of flow between the point
                                             of critical depth and the end of the sewer. This additional distance is relatively small, namely,
                                             4dc   4   4.7   18.8 ft (5.73 m).


                     Table 13.2  Calculation of Drawdown Curve for Example 13.11 (columns as in Table 13.1)
                      d        d>D       a>A       r>R      N>n       a         r        v        h v      d +  h v
                      (1)      (2)       (3)       (4)      (5)       (6)      (7)       (8)      (9)       (10)

                      4.7     0.47      0.463     0.960     0.79     36.4     2.40      11.0      1.88      6.58
                      6.0     0.60      0.626     1.110     0.82     49.1     2.78      8.15      1.02      7.02
                      8.0     0.80      0.858     1.217     0.89     67.5     3.04      5.93      0.54      8.54
                     10.0     1.00      1.000     1.000     1.00     78.5     2.50      5.10      0.40     10.40

                                                Average
                     n *  10 2  nv *  10 2  r   r 2/3  nv *  10 2  s *  10 4  (s -  i) *  10 4  ¢  (d +  h v )  ¢l  g¢l
                       (11)      (12)    (13)  (14)     (15)     (16)        (17)         (18)     (19)     (20)
                       1.52     16.8                                                                           0
                                         2.59  1.88     14.3     26.2        21.2        0.44        210
                       1.46     11.9                                                                         210
                                         2.91  2.04      9.9     10.65       5.65        1.52      2,690
                       1.35     7.99                                                                        2,900
                                         2.77  1.97      7.1      5.90       0.90        1.86     20,700
                       1.20     6.12                                                                       23,600
   513   514   515   516   517   518   519   520   521   522   523