Page 517 - Fair, Geyer, and Okun's Water and wastewater engineering : water supply and wastewater removal
P. 517

JWCL344_ch13_457-499.qxd  8/7/10  8:49 PM  Page 475


                                                                                         13.7 Length of Transitions  475


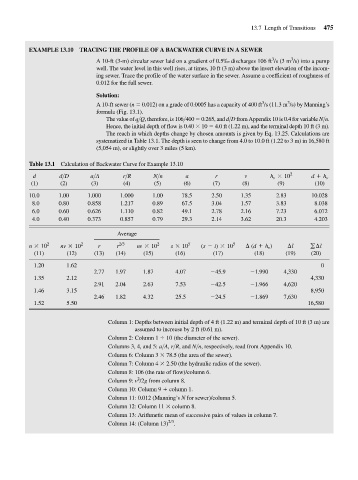
                     EXAMPLE 13.10  TRACING THE PROFILE OF A BACKWATER CURVE IN A SEWER
                                                                                               3
                                                                                                     3
                                         A 10-ft (3-m) circular sewer laid on a gradient of 0.5‰ discharges 106 ft /s (3 m /s) into a pump
                                          well. The water level in this well rises, at times, 10 ft (3 m) above the invert elevation of the incom-
                                          ing sewer. Trace the profile of the water surface in the sewer. Assume a coefficient of roughness of
                                          0.012 for the full sewer.
                                          Solution:
                                                                                            3
                                                                                                    3
                                          A 10-ft sewer (n   0.012) on a grade of 0.0005 has a capacity of 400 ft /s (11.3 m /s) by Manning’s
                                         formula (Fig. 13.1).
                                             The value of q>Q, therefore, is 106>400   0.265, and d>D from Appendix 10 is 0.4 for variable N>n.
                                             Hence, the initial depth of flow is 0.40   10   4.0 ft (1.22 m), and the terminal depth 10 ft (3 m).
                                             The reach in which depths change by chosen amounts is given by Eq. 13.25. Calculations are
                                          systematized in Table 13.1. The depth is seen to change from 4.0 to 10.0 ft (1.22 to 3 m) in 16,580 ft
                                          (5,054 m), or slightly over 3 miles (5 km).

                     Table 13.1  Calculation of Backwater Curve for Example 13.10

                      d       d>D       a>A       r>R      N>n       a        r       v       h v *  10 2  d +  h v
                      (1)      (2)      (3)       (4)      (5)      (6)      (7)      (8)        (9)        (10)
                     10.0     1.00     1.000     1.000     1.00    78.5     2.50     1.35       2.83       10.028
                      8.0     0.80     0.858     1.217     0.89    67.5     3.04     1.57       3.83        8.038
                      6.0     0.60     0.626     1.110     0.82    49.1     2.78     2.16       7.23        6.072
                      4.0     0.40     0.373     0.857     0.79    29.3     2.14     3.62       20.3        4.203

                                                Average
                     n *  10 2  nv *  10 2  r   r 2/3  nv *  10 2  s *  10 5  (s -  i) *  10 5  ¢  (d +  h v )  ¢l  g¢l
                       (11)      (12)    (13)  (14)     (15)      (16)       (17)        (18)      (19)    (20)

                       1.20     1.62                                                                          0
                                         2.77  1.97     1.87      4.07      - 45.9      - 1.990   4,330
                       1.35     2.12                                                                       4,330
                                         2.91  2.04     2.63      7.53      - 42.5      - 1.966   4,620
                       1.46     3.15                                                                       8,950
                                         2.46  1.82     4.32      25.5      - 24.5      - 1.869   7,630
                       1.52     5.50                                                                      16,580

                                             Column 1: Depths between initial depth of 4 ft (1.22 m) and terminal depth of 10 ft (3 m) are
                                                     assumed to increase by 2 ft (0.61 m).
                                             Column 2: Column 1 	 10 (the diameter of the sewer).
                                             Columns 3, 4, and 5: a>A, r>R, and N>n, respectively, read from Appendix 10.
                                             Column 6: Column 3   78.5 (the area of the sewer).
                                             Column 7: Column 4   2.50 (the hydraulic radius of the sewer).
                                             Column 8: 106 (the rate of flow)/column 6.
                                                      2
                                             Column 9: v /2g from column 8.
                                             Column 10: Column 9   column 1.
                                             Column 11: 0.012 (Manning’s N for sewer)/column 5.
                                             Column 12: Column 11   column 8.
                                             Column 13: Arithmetic mean of successive pairs of values in column 7.
                                                               2/3
                                             Column 14: (Column 13) .
   512   513   514   515   516   517   518   519   520   521   522