
Page 558 - Fair, Geyer, and Okun's Water and wastewater engineering : water supply and wastewater removal
P. 558
JWCL344_ch14_500-554.qxd 8/7/10 8:56 PM Page 516
516 Chapter 14 Design of Sewer Systems Sill #41
Sill #569 hiram mills street Sill #15 Sill #22 Sill #21 Sill #24 Sill #30 Sill #33 Sill #34 Sill #40
Hiram mills street •1˝ Gas Sill #27 Cinders Tarvia Loam 1˝ Gas
Gravel fill
Tarvia Cinders Gravel fill 10˝ v.c. 5 ˝ water
drain
164.59´ 9
Loam • 5 ˝ water• 5 ˝ water•
Gravel fill 1˝ Gas 8 8 • 1˝ Gas 5 ˝ water 5.28%
9
10˝ v.c. drain 3.36% Nest of
4˝ Gas 10˝−12˝ boulders Underdrain
8 inch vit. clay pipe sewer
Tel. cond. 135.86´
10˝ C.I. 10˝ v.c. and clay mixture Underdrain • 1˝ Gas 219.78´
water
8 inch vitrified clay pipe sewer
6˝ C.I. water Loam 5 ˝ water
Drains Gravel 8
10˝ v.c. 1.80% Gravel
8 inch v.c. sewer 6˝ of pea gravel
12˝ v.c.
6˝ of pea gravel 1 43.5 Y.R. 1 48.5 Y.L. 1 77.6 Y.L. 1 94.5 Y.R. 2 21.5 Y.R. 2 25.6 Y.L. 2 45.6 Y.L. 2 69.5 Y.R. 2 79.8 Y.L. 2 84.8 Y.R. 2 93.0 Y.R. − − − 4 11.0 Y.R. 4 16.0 Y.L. 4 36.0 Y.R. 4 41.2 Y.L. 4 69.9 Y.L. 4 92.7 Y.R. 5 07.0 Y.L. 5 15.1 Y.R.
119.5 111.19 120.2 0 98.5 Y.R. 120.6 1 06.5 Y.L. 121.1 113.64 121.6 122.7 124.0 126.2 119.18 3 08.7 Y.L. 3 40.6 Y.R. 3 45.5 Y.L. 129.0 3 59.6 Y.R. − 3 73.6 Y.L. − 3 84.9 Y.R. − 131.9 134.6 137.3 138.3 130.80
Base elev. 105.00 Base elev. 115.00
0 1 1 35.86 2 3 00.48 4 5 20.23
Lemuel Shattuck Street
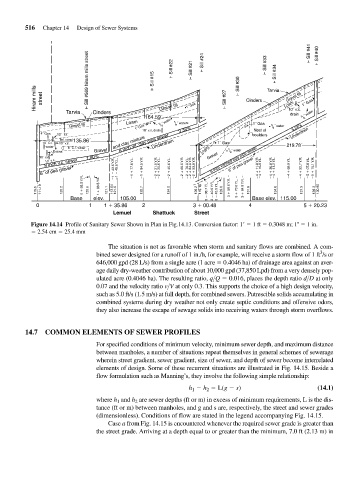
Figure 14.14 Profile of Sanitary Sewer Shown in Plan in Fig.14.13. Conversion factor: 1 1 ft 0.3048 m; 1 1 in.
2.54 cm 25.4 mm
The situation is not as favorable when storm and sanitary flows are combined. A com-
3
bined sewer designed for a runoff of 1 in./h, for example, will receive a storm flow of 1 ft /s or
646,000 gpd (28 L/s) from a single acre (1 acre 0.4046 ha) of drainage area against an aver-
age daily dry-weather contribution of about 10,000 gpd (37,850 Lpd) from a very densely pop-
ulated acre (0.4046 ha). The resulting ratio, q>Q 0.016, places the depth ratio d>D at only
0.07 and the velocity ratio v>V at only 0.3. This supports the choice of a high design velocity,
such as 5.0 ft/s (1.5 m/s) at full depth, for combined sewers. Putrescible solids accumulating in
combined systems during dry weather not only create septic conditions and offensive odors,
they also increase the escape of sewage solids into receiving waters through storm overflows.
14.7 COMMON ELEMENTS OF SEWER PROFILES
For specified conditions of minimum velocity, minimum sewer depth, and maximum distance
between manholes, a number of situations repeat themselves in general schemes of sewerage
wherein street gradient, sewer gradient, size of sewer, and depth of sewer become interrelated
elements of design. Some of these recurrent situations are illustrated in Fig. 14.15. Beside a
flow formulation such as Manning’s, they involve the following simple relationship:
h h L(g s) (14.1)
1
2
where h and h are sewer depths (ft or m) in excess of minimum requirements, L is the dis-
2
1
tance (ft or m) between manholes, and g and s are, respectively, the street and sewer grades
(dimensionless). Conditions of flow are stated in the legend accompanying Fig. 14.15.
Case a from Fig. 14.15 is encountered whenever the required sewer grade is greater than
the street grade. Arriving at a depth equal to or greater than the minimum, 7.0 ft (2.13 m) in