
Page 160 - Finite Element Analysis with ANSYS Workbench
P. 160
8.2 Fatigue and Life Prediction 151
Stress
a
max
m
min
Cycles
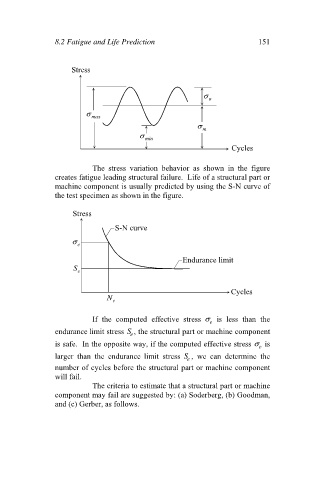
The stress variation behavior as shown in the figure
creates fatigue leading structural failure. Life of a structural part or
machine component is usually predicted by using the S-N curve of
the test specimen as shown in the figure.
Stress
S-N curve
e
Endurance limit
S e
Cycles
N e
If the computed effective stress is less than the
e
endurance limit stress S , the structural part or machine component
e
is safe. In the opposite way, if the computed effective stress is
e
larger than the endurance limit stress S , we can determine the
e
number of cycles before the structural part or machine component
will fail.
The criteria to estimate that a structural part or machine
component may fail are suggested by: (a) Soderberg, (b) Goodman,
and (c) Gerber, as follows.