
Page 150 - Finite Element Modeling and Simulations with ANSYS Workbench
P. 150
Two-Dimensional Elasticity 135
4.4.7.2 Averaged Stresses
Stresses are usually averaged at nodes in FEA software packages to provide more accurate
stress values. This option should be turned off at nodes between two materials or other
geometry discontinuity locations where stress discontinuity does exist.
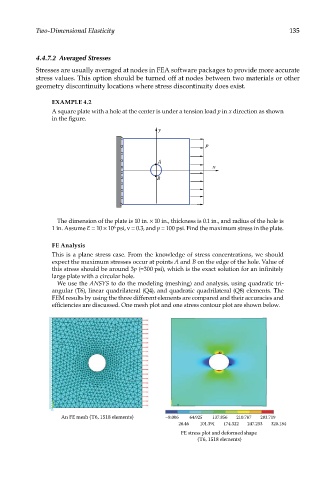
EXAMPLE 4.2
A square plate with a hole at the center is under a tension load p in x direction as shown
in the figure.
y
p
A
x
B
The dimension of the plate is 10 in. × 10 in., thickness is 0.1 in., and radius of the hole is
1 in. Assume E = 10 × 10 psi, ν = 0.3, and p = 100 psi. Find the maximum stress in the plate.
6
FE Analysis
This is a plane stress case. From the knowledge of stress concentrations, we should
expect the maximum stresses occur at points A and B on the edge of the hole. Value of
this stress should be around 3p (=300 psi), which is the exact solution for an infinitely
large plate with a circular hole.
We use the ANSYS to do the modeling (meshing) and analysis, using quadratic tri-
angular (T6), linear quadrilateral (Q4), and quadratic quadrilateral (Q8) elements. The
FEM results by using the three different elements are compared and their accuracies and
efficiencies are discussed. One mesh plot and one stress contour plot are shown below.
An FE mesh (T6, 1518 elements) –8.006 64.925 137.856 210.787 283.719
28.46 101.391 174.322 247.253 320.184
FE stress plot and deformed shape
(T6, 1518 elements)