
Page 470 - Flexible Robotics in Medicine
P. 470
464 Chapter 20
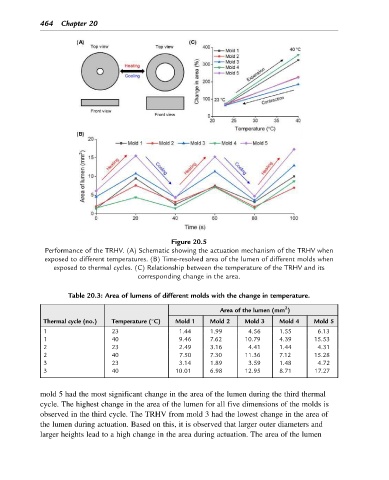
Figure 20.5
Performance of the TRHV. (A) Schematic showing the actuation mechanism of the TRHV when
exposed to different temperatures. (B) Time-resolved area of the lumen of different molds when
exposed to thermal cycles. (C) Relationship between the temperature of the TRHV and its
corresponding change in the area.
Table 20.3: Area of lumens of different molds with the change in temperature.
2
Area of the lumen (mm )
Thermal cycle (no.) Temperature ( C) Mold 1 Mold 2 Mold 3 Mold 4 Mold 5
1 23 1.44 1.99 4.56 1.55 6.13
1 40 9.46 7.62 10.79 4.39 15.53
2 23 2.49 3.16 4.41 1.44 4.31
2 40 7.50 7.30 11.36 7.12 15.28
3 23 3.14 1.89 3.59 1.48 4.72
3 40 10.01 6.98 12.95 8.71 17.27
mold 5 had the most significant change in the area of the lumen during the third thermal
cycle. The highest change in the area of the lumen for all five dimensions of the molds is
observed in the third cycle. The TRHV from mold 3 had the lowest change in the area of
the lumen during actuation. Based on this, it is observed that larger outer diameters and
larger heights lead to a high change in the area during actuation. The area of the lumen