
Page 110 - Fluid Power Engineering
P. 110
84 Cha pte r T h ree
(b)
(c)
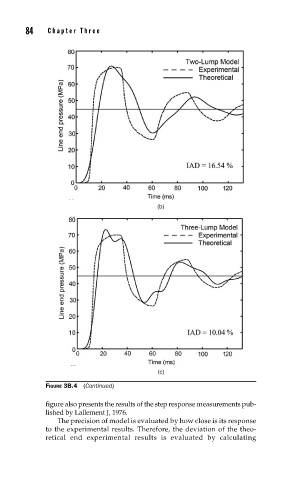
FIGURE 3B.4 (Continued)
figure also presents the results of the step response measurements pub-
lished by Lallement J, 1976.
The precision of model is evaluated by how close is its response
to the experimental results. Therefore, the deviation of the theo-
retical end experimental results is evaluated by calculating