
Page 112 - Fluid Power Engineering
P. 112
86 Cha pte r T h ree
where IAD = Integral of absolute difference, %
P = Experimentally evaluated pressure at the closed end, Pa
Lexp
P = Steady-state pressure at the closed end, Pa
Lss
P = Theoretically evaluated pressure at the closed end, Pa
Lth
T = Time duration of the response, s
The study of Fig. 3B.4 shows that the three-lump and four-lump
models agree satisfactorily with the experimental results. The calcu-
lated integral absolute difference decreased rapidly with the increase
in the number of lumps.
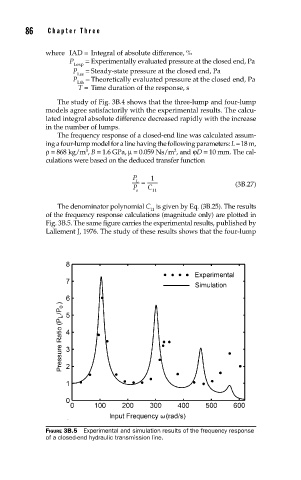
The frequency response of a closed-end line was calculated assum-
ing a four-lump model for a line having the following parameters: L = 18 m,
3
2
ρ = 868 kg/m , B = 1.6 GPa, μ = 0.059 Ns/m , and ϕD = 10 mm. The cal-
culations were based on the deduced transfer function
P 1
L =
P C (3B.27)
o 11
The denominator polynomial C is given by Eq. (3B.25). The results
11
of the frequency response calculations (magnitude only) are plotted in
Fig. 3B.5. The same figure carries the experimental results, published by
Lallement J, 1976. The study of these results shows that the four-lump
FIGURE 3B.5 Experimental and simulation results of the frequency response
of a closed-end hydraulic transmission line.