
Page 33 - T. Anderson-Fracture Mechanics - Fundamentals and Applns.-CRC (2005)
P. 33
1656_C01.fm Page 13 Tuesday, April 12, 2005 5:55 PM
History and Overview 13
(a)
(b)
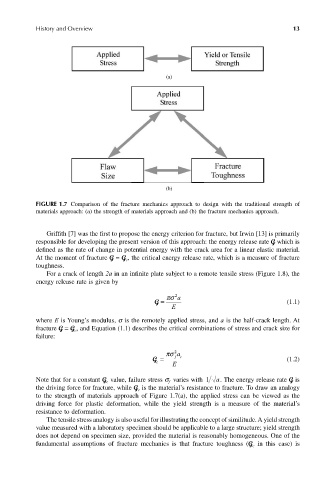
FIGURE 1.7 Comparison of the fracture mechanics approach to design with the traditional strength of
materials approach: (a) the strength of materials approach and (b) the fracture mechanics approach.
Griffith [7] was the first to propose the energy criterion for fracture, but Irwin [13] is primarily
responsible for developing the present version of this approach: the energy release rate G which is
defined as the rate of change in potential energy with the crack area for a linear elastic material.
At the moment of fracture G = G , the critical energy release rate, which is a measure of fracture
c
toughness.
For a crack of length 2a in an infinite plate subject to a remote tensile stress (Figure 1.8), the
energy release rate is given by
πσ a
2
G = (1.1)
E
where E is Young’s modulus, σ is the remotely applied stress, and a is the half-crack length. At
fracture G = G , and Equation (1.1) describes the critical combinations of stress and crack size for
c
failure:
πσ 2 a
G = E f c (1.2)
c
Note that for a constant G value, failure stress σ varies with 1 a . The energy release rate G is
f
c
the driving force for fracture, while G is the material’s resistance to fracture. To draw an analogy
c
to the strength of materials approach of Figure 1.7(a), the applied stress can be viewed as the
driving force for plastic deformation, while the yield strength is a measure of the material’s
resistance to deformation.
The tensile stress analogy is also useful for illustrating the concept of similitude. A yield strength
value measured with a laboratory specimen should be applicable to a large structure; yield strength
does not depend on specimen size, provided the material is reasonably homogeneous. One of the
fundamental assumptions of fracture mechanics is that fracture toughness (G in this case) is
c