
Page 129 - Fundamentals of Communications Systems
P. 129
Complex Baseband Representation of Bandpass Signals 4.5
3
2
1
0
x c (t)
−1
−2
−3
0 0.5 1 0.5 2
Normalized Time, f t
m
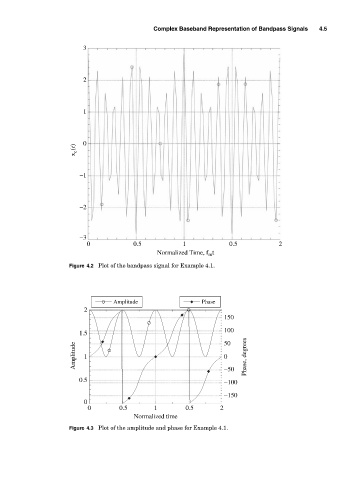
Figure 4.2 Plot of the bandpass signal for Example 4.1.
Amplitude Phase
2
150
100
1.5 50
Amplitude 1 0 Phase, degrees
0.5 −50
−100
−150
0
0 0.5 1 0.5 2
Normalized time
Figure 4.3 Plot of the amplitude and phase for Example 4.1.