Page 131 - Fundamentals of Communications Systems
P. 131

Complex Baseband Representation of Bandpass Signals  4.7

                                                            1
                                                           0.8
               1
                                                           0.6
              0.5                                          0.4
                                                           0.2
            x Q (t)  0                                   x Q (t)  0

             −0.5                                         −0.2
                                                          −0.4
               −1                                         −0.6
                0                                    1
                 0.5                             0.5
                     1                                    −0.8
                        1.5                 0
                           2            −0.5               −1
                                              I
                   Time, t/f m  2.5  3  −1    x (t)         −1 −0.8 −0.6 −0.4 −0.2  0  0.2  0.4  0.6  0.8  1
                                                                            x (t)
                                                                             I
                    (a) The three dimensional plot.          (b) The projection onto the x (t), x (t) plane.
                                                                                  I
                                                                                      Q
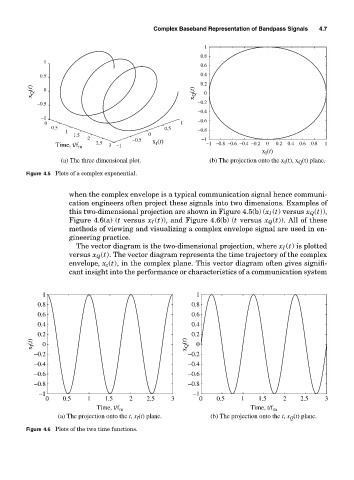
          Figure 4.5 Plots of a complex exponential.
                      when the complex envelope is a typical communication signal hence communi-
                      cation engineers often project these signals into two dimensions. Examples of
                      this two-dimensional projection are shown in Figure 4.5(b) (x I (t) versus x Q (t)),
                      Figure 4.6(a) (t versus x I (t)), and Figure 4.6(b) (t versus x Q (t)). All of these
                      methods of viewing and visualizing a complex envelope signal are used in en-
                      gineering practice.
                        The vector diagram is the two-dimensional projection, where x I (t) is plotted
                      versus x Q (t). The vector diagram represents the time trajectory of the complex
                      envelope, x z (t), in the complex plane. This vector diagram often gives signifi-
                      cant insight into the performance or characteristics of a communication system


               1                                          1
              0.8                                       0.8
              0.6                                       0.6
              0.4                                       0.4
              0.2                                       0.2
            x I (t)  0                                 x Q (t)  0
             −0.2                                      −0.2
             −0.4                                      −0.4
             −0.6                                      −0.6
             −0.8                                      −0.8
              −1                                         −1
                0    0.5   1    1.5    2    2.5    3       0   0.5    1    1.5    2    2.5   3
                              Time, t/f m                                Time, t/f m
                   (a) The projection onto the t, x (t) plane.  (b) The projection onto the t, x (t) plane.
                                                                                    Q
                                         I
          Figure 4.6 Plots of the two time functions.
   126   127   128   129   130   131   132   133   134   135   136