Page 68 - Fundamentals of Communications Systems
P. 68

2.20  Chapter Two

               5000                                       10
               4000                                        0

               3000                                      −10
               2000                                      −20
             h(t)                                       H(f)
               1000                                      −30

                  0                                      −40
              −1000                                      −50
              −2000                                      −60
                     0.038  0.042  0.046  0.05  0.054     −5000  −3000  −1000 0 1000  3000  5000
                               Time, t, sec                            Frequency, f, Hz
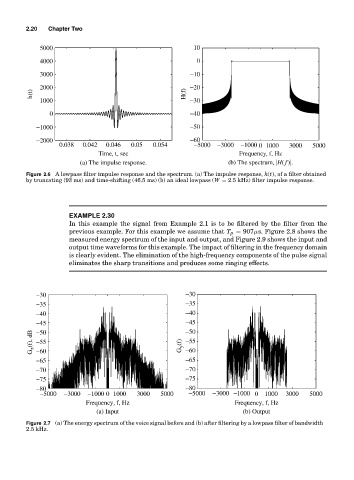
                          (a) The impulse response.                 (b) The spectrum, |H( f)|.
           Figure 2.6 A lowpass filter impulse response and the spectrum. (a) The impulse response, h(t), of a filter obtained
           by truncating (93 ms) and time-shifting (46.5 ms) (b) an ideal lowpass (W = 2.5 kHz) filter impulse response.


                       EXAMPLE 2.30
                       In this example the signal from Example 2.1 is to be filtered by the filter from the
                       previous example. For this example we assume that T p = 907µs. Figure 2.8 shows the
                       measured energy spectrum of the input and output, and Figure 2.9 shows the input and
                       output time waveforms for this example. The impact of filtering in the frequency domain
                       is clearly evident. The elimination of the high-frequency components of the pulse signal
                       eliminates the sharp transitions and produces some ringing effects.


              −30                                       −30
              −35                                       −35
              −40                                       −40
              −45                                       −45
                                                        −50
             G x (f), dB  −55                         G y (f)  −55
              −50
                                                        −60
              −60
              −65                                       −65
              −70                                       −70
              −75                                       −75
              −80                                       −80
               −5000  −3000  −1000 0 1000  3000  5000    −5000  −3000 −1000 0  1000  3000  5000
                            Frequency, f, Hz                         Frequency, f, Hz
                               (a) Input                                (b) Output
           Figure 2.7 (a) The energy spectrum of the voice signal before and (b) after filtering by a lowpass filter of bandwidth
           2.5 kHz.
   63   64   65   66   67   68   69   70   71   72   73