
Page 222 - Fundamentals of Gas Shale Reservoirs
P. 222
202 ROCK PHYSICS ANALYSIS OF SHALE RESERVOIRS
(a) (b) (c)
Seismic pro le + AI pro le AI TOC % pro le 10
100 ms
9
– 8000 8
Top source rock 7
7000 6
5
4
6000 3
Base source rock 1 km
TOC %
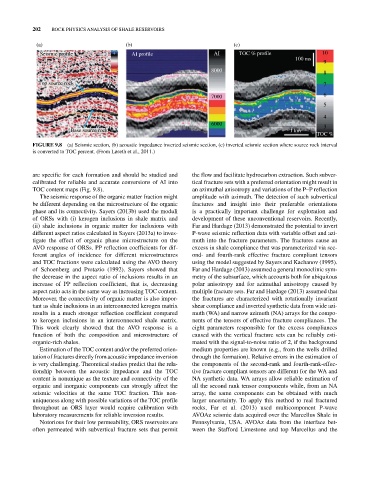
FIGURE 9.8 (a) Seismic section, (b) acoustic impedance inverted seismic section, (c) inverted seismic section where source rock interval
is converted to TOC percent. (From Løseth et al., 2011.)
are specific for each formation and should be studied and the flow and facilitate hydrocarbon extraction. Such subver
calibrated for reliable and accurate conversions of AI into tical fracture sets with a preferred orientation might result in
TOC content maps (Fig. 9.8). an azimuthal anisotropy and variations of the P–P reflection
The seismic response of the organic matter fraction might amplitude with azimuth. The detection of such subvertical
be different depending on the microstructure of the organic fractures and insight into their preferable orientations
phase and its connectivity. Sayers (2013b) used the moduli is a practically important challenge for exploration and
of ORSs with (i) kerogen inclusions in shale matrix and development of these unconventional reservoirs. Recently,
(ii) shale inclusions in organic matter for inclusions with Far and Hardage (2013) demonstrated the potential to invert
different aspect ratios calculated in Sayers (2013a) to inves P‐wave seismic reflection data with variable offset and azi
tigate the effect of organic phase microstructure on the muth into the fracture parameters. The fractures cause an
AVO response of ORSs. PP reflection coefficients for dif excess in shale compliance that was parameterized via sec
ferent angles of incidence for different microstructures ond‐ and fourth‐rank effective fracture compliant tensors
and TOC fractions were calculated using the AVO theory using the model suggested by Sayers and Kachanov (1995).
of Schoenberg and Protazio (1992). Sayers showed that Far and Hardage (2013) assumed a general monoclinic sym
the decrease in the aspect ratio of inclusions results in an metry of the subsurface, which accounts both for ubiquitous
increase of PP reflection coefficient, that is, decreasing polar anisotropy and for azimuthal anisotropy caused by
aspect ratio acts in the same way as increasing TOC content. multiple fracture sets. Far and Hardage (2013) assumed that
Moreover, the connectivity of organic matter is also impor the fractures are characterized with rotationally invariant
tant as shale inclusions in an interconnected kerogen matrix shear compliance and inverted synthetic data from wide azi
results in a much stronger reflection coefficient compared muth (WA) and narrow azimuth (NA) arrays for the compo
to kerogen inclusions in an interconnected shale matrix. nents of the tensors of effective fracture compliances. The
This work clearly showed that the AVO response is a eight parameters responsible for the excess compliances
function of both the composition and microstructure of caused with the vertical fracture sets can be reliably esti
organic‐rich shales. mated with the signal‐to‐noise ratio of 2, if the background
Estimation of the TOC content and/or the preferred orien medium properties are known (e.g., from the wells drilled
tation of fractures directly from acoustic impedance inversion through the formation). Relative errors in the estimation of
is very challenging. Theoretical studies predict that the rela the components of the second‐rank and fourth‐rank‐effec
tionship between the acoustic impedance and the TOC tive fracture compliant tensors are different for the WA and
content is nonunique as the texture and connectivity of the NA synthetic data. WA arrays allow reliable estimation of
organic and inorganic components can strongly affect the all the second rank tensor components while, from an NA
seismic velocities at the same TOC fraction. This non array, the same components can be obtained with much
uniqueness along with possible variations of the TOC profile larger uncertainty. To apply this method to real fractured
throughout an ORS layer would require calibration with rocks, Far et al. (2013) used multicomponent P‐wave
laboratory measurements for reliable inversion results. AVOAz seismic data acquired over the Marcellus Shale in
Notorious for their low permeability, ORS reservoirs are Pennsylvania, USA. AVOAz data from the interface bet
often permeated with subvertical fracture sets that permit ween the Stafford Limestone and top Marcellus and the