
Page 221 - Fundamentals of Gas Shale Reservoirs
P. 221
SEISMIC RESPONSE OF ORSS 201
Hydrous pyrolysis results in generation of hydrocarbons transversely isotropic ORS layer of variable thickness is
and evaporation of volatile hydrocarbons caused by high deposited between isotropic chalk (top) and sandstone (bot
retort temperatures. Films of bitumen, bitumen globes, and tom). This structure models a typical structure in the North
bitumen flow channels were observed in the FESEM images Sea, where a source rock with a thickness comparable to the
of the samples after pyrolysis. These changes led to a seismic wavelength (<200 m) underlies a high velocity
decrease in average TOC from 12.7 ± 4.3 to 9.7 ± 1.6 and chalk. The shale, chalk, and sandstone were modeled as vis
average HI from 400 ± 231 to 51.2 ± 16.8. The median coelastic materials. The ORS was assumed to be a composite
Young’s moduli also reduced from 25.2 ± 6.3 to 15.7 ± 5.3. rock with horizontal layers of illite, kerogen, water, and oil,
To explain an apparent discrepancy with the well‐known fact where the amount of oil depends on maturity of the rock.
that more mature shales usually have higher elastic moduli, The modeled AVO response shows a strong decrease in the
Zargari et al. (2013) speculated that bitumen, which had PP‐reflection coefficient with an increase in the incidence
lower compared to kerogen elastic moduli and which would angle. For a given TOC content and incident angle, the
eventually migrate away in the process of natural matura reflection coefficient dependency on ORS layer thickness
tion, was partially trapped in the kerogen and caused the exhibits an oscillatory character and the period of oscilla
reduction in the mean elastic moduli after pyrolysis. tions depends on the frequency of the seismic signal. Finally,
We would like to say again that the effects of organic for a given layer thickness and incidence angle, the reflec
matter maturity on anisotropic elastic properties are complex tion coefficient depends on the TOC content in a nonmono
and include microstructural transformations, decrease of tonic way, having a minimum at a low volumetric kerogen
TOC content, and changes in elastic moduli of organic and content and above this value exhibiting a monotonic increase.
inorganic components. The lenticular distribution of kerogen The ability to predict the TOC content from surface
in immature ORS is believed to be the reason for extraordi seismic data would significantly reduce the risk of devel
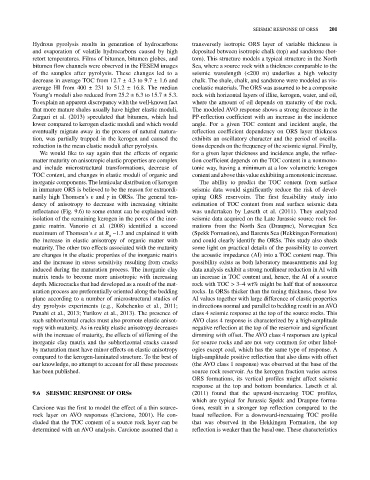
narily high Thomsen’s ε and γ in ORSs. The general ten oping ORS reservoirs. The first feasibility study into
dency of anisotropy to decrease with increasing vitrinite estimation of TOC content from real surface seismic data
reflectance (Fig. 9.6) to some extent can be explained with was undertaken by Løseth et al. (2011). They analyzed
isolation of the remaining kerogen in the pores of the inor seismic data acquired on the Late Jurassic source rock for
ganic matrix. Vanorio et al. (2008) identified a second mations from the North Sea (Draupne), Norwegian Sea
maximum of Thomsen’s ε at R ~1.3 and explained it with (Spekk Formation), and Barents Sea (Hekkingen Formation)
0
the increase in elastic anisotropy of organic matter with and could clearly identify the ORSs. This study also sheds
maturity. The other two effects associated with the maturity some light on practical details of the possibility to convert
are changes in the elastic properties of the inorganic matrix the acoustic impedance (AI) into a TOC content map. This
and the increase in stress sensitivity resulting from cracks possibility exists as both laboratory measurements and log
induced during the maturation process. The inorganic clay data analysis exhibit a strong nonlinear reduction in AI with
matrix tends to become more anisotropic with increasing an increase in TOC content and, hence, the AI of a source
depth. Microcracks that had developed as a result of the mat rock with TOC > 3–4 wt% might be half that of nonsource
uration process are preferentially oriented along the bedding rocks. In ORSs thicker than the tuning thickness, these low
plane according to a number of microstructural studies of AI values together with large difference of elastic properties
dry pyrolysis experiments (e.g., Kobchenko et al., 2011; in directions normal and parallel to bedding result in an AVO
Panahi et al., 2013; Yurikov et al., 2013). The presence of class 4 seismic response at the top of the source rocks. This
such subhorizontal cracks must also promote elastic anisot AVO class 4 response is characterized by a high‐amplitude
ropy with maturity. As in reality elastic anisotropy decreases negative reflection at the top of the reservoir and significant
with the increase of maturity, the effects of stiffening of the dimming with offset. The AVO class 4 responses are typical
inorganic clay matrix and the subhorizontal cracks caused for source rocks and are not very common for other lithol
by maturation must have minor effects on elastic anisotropy ogies except coal, which has the same type of response. A
compared to the kerogen‐laminated structure. To the best of high‐amplitude positive reflection that also dims with offset
our knowledge, no attempt to account for all these processes (the AVO class 1 response) was observed at the base of the
has been published. source rock reservoir. As the kerogen fraction varies across
ORS formations, its vertical profiles might affect seismic
response at the top and bottom boundaries. Løseth et al.
9.6 SEISMIC RESPONSE OF ORSs (2011) found that the upward‐increasing TOC profiles,
which are typical for Jurassic Spekk and Draupne forma
Carcione was the first to model the effect of a thin source‐ tions, result in a stronger top reflection compared to the
rock layer on AVO responses (Carcione, 2001). He con basal reflection. For a downward‐increasing TOC profile
cluded that the TOC content of a source rock layer can be that was observed in the Hekkingen Formation, the top
determined with an AVO analysis. Carcione assumed that a reflection is weaker than the basal one. These characteristics