
Page 219 - Fundamentals of Gas Shale Reservoirs
P. 219
MATURITY EFFECTS 199
1.5 1.15
Post mature
Post mature
1.4 1.05
1.1
Normalized V p(0) (km/s) 1.2 Normalized V p (90) (km/s) 0.95 1 Peak maturity
1.3
1.1
1
0.9
0.9 Peak maturity 0.85
0.8 0.8
1.5 1.15
1.1
1.4 1.05 Post mature
Normalized V s (0) (km/s) 1.2 Post mature Normalized V s (90) (km/s) 0.95 1 Peak maturity
1.3
1.1
0.9
1
0.9 Peak maturity 0.85
0.8 0.8
0 20 40 60 80 100 0 20 40 60 80 100
Pressure (MPa) Pressure (MPa)
0.6 R (%) 1.4
o
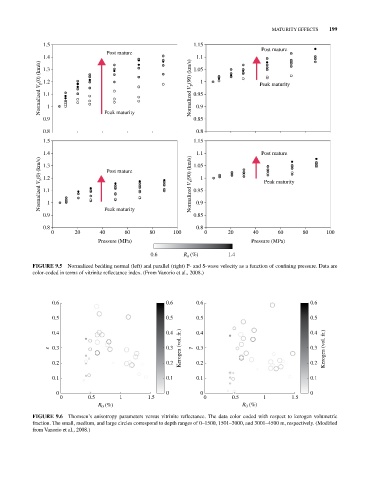
FIGURE 9.5 Normalized bedding normal (left) and parallel (right) P‐ and S‐wave velocity as a function of confining pressure. Data are
color‐coded in terms of vitrinite reflectance index. (From Vanorio et al., 2008.)
0.6 0.6 0.6 0.6
0.5 0.5 0.5 0.5
Kerogen (vol. fr.) Kerogen (vol. fr.)
0.4 0.4 0.4 0.4
0.3 0.3 0.3 0.3
0.2 0.2 0.2 0.2
0.1 0.1 0.1 0.1
0 0 0 0
0 0.5 1 1.5 0 0.5 1 1.5
R (%) R (%)
0
0
FIGURE 9.6 Thomsen’s anisotropy parameters versus vitrinite reflectance. The data color coded with respect to kerogen volumetric
fraction. The small, medium, and large circles correspond to depth ranges of 0–1500, 1501–3000, and 3001–4500 m, respectively. (Modified
from Vanorio et al., 2008.)