
Page 214 - Fundamentals of Gas Shale Reservoirs
P. 214
90 90
80 80
70 70
60
60
c 11 (GPa) 50 c 33 (GPa) 50
40
40
30 30
20 20
10 10
0 0.1 0.2 0.3 0.4 0.5 0 0.1 0.2 0.3 0.4 0.5
Kerogen (vol) Kerogen (vol)
35 35
30 30
25 25
c 44 (GPa) 20 c 66 (GPa) 20
15
15
10 10
5 5
0 0.1 0.2 0.3 0.4 0.5 0 0.1 0.2 0.3 0.4 0.5
Kerogen (vol) Kerogen (vol)
30 1
25
0.8
20 0.6
c 13 (GPa) 15
10 0.4
5 0.2
0 0
0 0.1 0.2 0.3 0.4 0 0.1 0.2 0.3 0.4
Kerogen (vol) Kerogen (vol)
1
0.4
0.8
0.3
0.6 0.2
0.4 0.1
0
0.2
–0.1
0 –0.2
0 0.1 0.2 0.3 0.4 0 0.1 0.2 0.3 0.4
Kerogen (vol) Kerogen (vol)
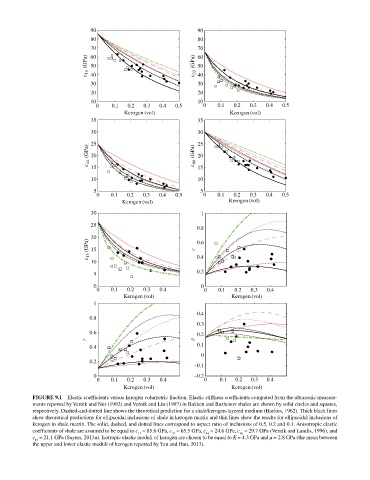
FIGURE 9.1 Elastic coefficients versus kerogen volumetric fraction. Elastic stiffness coefficients computed from the ultrasonic measure
ments reported by Vernik and Nur (1992) and Vernik and Liu (1997) in Bakken and Bazhenov shales are shown by solid circles and squares,
respectively. Dashed‐and‐dotted line shows the theoretical prediction for a shale/kerogen‐layered medium (Backus, 1962). Thick black lines
show theoretical predictions for ellipsoidal inclusions of shale in kerogen matrix and thin lines show the results for ellipsoidal inclusions of
kerogen in shale matrix. The solid, dashed, and dotted lines correspond to aspect ratio of inclusions of 0.5, 0.2 and 0.1. Anisotropic elastic
coefficients of shale are assumed to be equal to c = 85.6 GPa, c = 65.5 GPa, c = 24.6 GPa, c = 29.7 GPa (Vernik and Landis, 1996), and
11
44
66
33
c = 21.1 GPa (Sayers, 2013a). Isotropic elastic moduli of kerogen are chosen to be equal to K = 4.3 GPa and μ = 2.8 GPa (the mean between
13
the upper and lower elastic moduli of kerogen reported by Yan and Han, 2013).