
Page 213 - Fundamentals of Gas Shale Reservoirs
P. 213
ORGANIC MATTER EFFECTS ON ELASTIC PROPERTIES 193
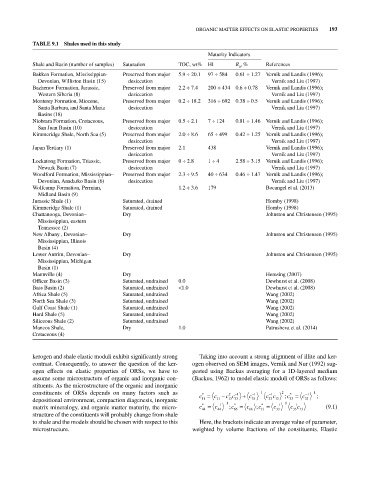
TABLE 9.1 Shales used in this study
Maturity Indicators
Shale and Basin (number of samples) Saturation TOC, wt% HI R , % References
0
Bakken Formation, Mississippian‐ Preserved from major 5.9 ÷ 20.1 97 ÷ 584 0.61 ÷ 1.27 Vernik and Landis (1996);
Devonian, Williston Basin (15) desiccation Vernik and Liu (1997)
Bazhenov Formation, Jurassic, Preserved from major 2.2 ÷ 7.4 200 ÷ 434 0.6 ÷ 0.78 Vernik and Landis (1996);
Western Siberia (8) desiccation Vernik and Liu (1997)
Monterey Formation, Miocene, Preserved from major 0.2 ÷ 18.2 316 ÷ 692 0.38 ÷ 0.5 Vernik and Landis (1996);
Santa Barbara, and Santa Maria desiccation Vernik and Liu (1997)
Basins (18)
Niobrara Formation, Cretaceous, Preserved from major 0.5 ÷ 2.1 7 ÷ 124 0.81 ÷ 1.46 Vernik and Landis (1996);
San Juan Basin (10) desiccation Vernik and Liu (1997)
Kimmeridge Shale, North Sea (5) Preserved from major 2.0 ÷ 8.6 65 ÷ 499 0.42 ÷ 1.25 Vernik and Landis (1996);
desiccation Vernik and Liu (1997)
Japan Tertiary (1) Preserved from major 2.1 438 Vernik and Landis (1996);
desiccation Vernik and Liu (1997)
Lockatong Formation, Triassic, Preserved from major 0 ÷ 2.8 1 ÷ 4 2.58 ÷ 3.15 Vernik and Landis (1996);
Newark Basin (7) desiccation Vernik and Liu (1997)
Woodford Formation, Mississippian– Preserved from major 2.3 ÷ 9.5 40 ÷ 634 0.46 ÷ 1.47 Vernik and Landis (1996);
Devonian, Anadarko Basin (6) desiccation Vernik and Liu (1997)
Wolfcamp Formation, Permian, 1.2 ÷ 3.6 179 Bocangel et al. (2013)
Midland Basin (9)
Jurassic Shale (1) Saturated, drained Hornby (1998)
Kimmeridge Shale (1) Saturated, drained Hornby (1998)
Chattanooga, Devonian– Dry Johnston and Christensen (1995)
Mississippian, eastern
Tennessee (2)
New Albany , Devonian– Dry Johnston and Christensen (1995)
Mississippian, Illinois
Basin (4)
Lower Antrim, Devonian– Dry Johnston and Christensen (1995)
Mississippian, Michigan
Basin (1)
Mannville (4) Dry Hemsing (2007)
Officer Basin (3) Saturated, undrained 0.0 Dewhurst et al. (2008)
Bass Basin (2) Saturated, undrained <1.0 Dewhurst et al. (2008)
Africa Shale (5) Saturated, undrained Wang (2002)
North Sea Shale (3) Saturated, undrained Wang (2002)
Gulf Coast Shale (1) Saturated, undrained Wang (2002)
Hard Shale (5) Saturated, undrained Wang (2002)
Siliceous Shale (2) Saturated, undrained Wang (2002)
Mancos Shale, Dry 1.0 Patrusheva et al. (2014)
Cretaceous (4)
kerogen and shale elastic moduli exhibit significantly strong Taking into account a strong alignment of illite and ker
contrast. Consequently, to answer the question of the ker ogen observed on SEM images, Vernik and Nur (1992) sug
ogen effects on elastic properties of ORSs, we have to gested using Backus averaging for a 1D‐layered medium
assume some microstructure of organic and inorganic con (Backus, 1962) to model elastic moduli of ORSs as follows:
stituents. As the microstructure of the organic and inorganic
constituents of ORSs depends on many factors such as c * c cc 1 c 1 1 c c 2 c ; * c 1 1 ;
2
1
depositional environment, compaction diagenesis, inorganic 11 11 1 13 33 33 33 13 1 33 33
1
*
matrix mineralogy, and organic matter maturity, the micro c * 44 c 44 1 1 ;c * 66 c 66 ;c 13 c 33 1 cc (9.1)
33 13
structure of the constituents will probably change from shale
to shale and the models should be chosen with respect to this Here, the brackets indicate an average value of parameter,
microstructure. weighted by volume fractions of the constituents. Elastic