
Page 217 - Fundamentals of Gas Shale Reservoirs
P. 217
MATURITY EFFECTS 197
(a)
9000 Water saturation 1
8500
8000
7500
V s (ft/s) 7000
6500
6000
5500
5000 0
8,000 9,000 10,000 11,000 12,000 13,000 14,000 15,000
V (ft/s)
p
(b)
9000 20
8500 18
8000 16
7500 14
7000 12
V s (ft/s) 6500 10 TOC (%)
8
6000
5500 6
5000 4
4500 2
4000 0
0.8 0.9 1 1.1 1.2 1.3 1.4 1.5 1.6
V (ft/s) ×10 4
p
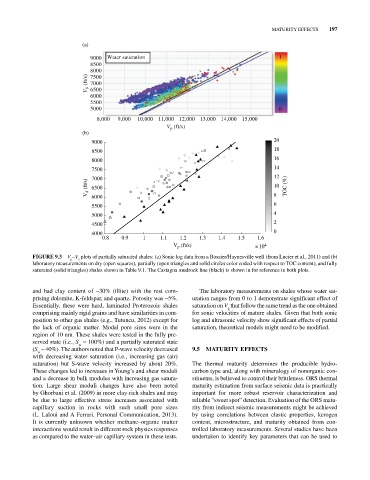
FIGURE 9.3 V –V plots of partially saturated shales: (a) Sonic log data from a Bossier/Haynesville well (from Lucier et al., 2011) and (b)
s
p
laboratory measurements on dry (open squares), partially (open triangles and solid circles color coded with respect to TOC content), and fully
saturated (solid triangles) shales shown in Table 9.1. The Castagna mudrock line (black) is shown in for reference in both plots.
and had clay content of ~30% (illite) with the rest com The laboratory measurements on shales whose water sat
prising dolomite, K‐feldspar, and quartz. Porosity was ~5%. uration ranges from 0 to 1 demonstrate significant effect of
Essentially, these were hard, laminated Proterozoic shales saturation on V that follow the same trend as the one obtained
p
comprising mainly rigid grains and have similarities in com for sonic velocities of mature shales. Given that both sonic
position to other gas shales (e.g., Tutuncu, 2012) except for log and ultrasonic velocity show significant effects of partial
the lack of organic matter. Modal pore sizes were in the saturation, theoretical models might need to be modified.
region of 10 nm. These shales were tested in the fully pre
served state (i.e., S = 100%) and a partially saturated state
w
(S ~ 40%). The authors noted that P‐wave velocity decreased 9.5 MATURITY EFFECTS
w
with decreasing water saturation (i.e., increasing gas (air)
saturation) but S‐wave velocity increased by about 20%. The thermal maturity determines the producible hydro
These changes led to increases in Young’s and shear moduli carbon type and, along with mineralogy of nonorganic con
and a decrease in bulk modulus with increasing gas satura stituents, is believed to control their brittleness. ORS thermal
tion. Large shear moduli changes have also been noted maturity estimation from surface seismic data is practically
by Ghorbani et al. (2009) in more clay‐rich shales and may important for more robust reservoir characterization and
be due to large effective stress increases associated with reliable “sweet spot” detection. Evaluation of the ORS matu
capillary suction in rocks with such small pore sizes rity from indirect seismic measurements might be achieved
(L. Laloui and A Ferrari, Personal Communication, 2013). by using correlations between elastic properties, kerogen
It is currently unknown whether methane–organic matter content, microstructure, and maturity obtained from con
interactions would result in different rock physics responses trolled laboratory measurements. Several studies have been
as compared to the water–air capillary system in these tests. undertaken to identify key parameters that can be used to