
Page 218 - Fundamentals of Gas Shale Reservoirs
P. 218
198 ROCK PHYSICS ANALYSIS OF SHALE RESERVOIRS
4.5 Thomsen’s anisotropy parameters ε and γ versus vitrinite
index (widely used as a proxy for maturity) exhibit complex
4.0 dependency with two peaks which have been explained with
alignment of clay platelets, kerogen inclusions, subhorizon
Velocity (km/s) 3.0 V dry of studies point out the necessity to take into account com
3.5
tal cracks as well as changes of vitrinite alignment. A number
V wet
p
p
paction trends of the inorganic matrix as well as the changes
V wet
s
V dry
of elastic properties of organic constituent and the micro
s
2.5
structural changes (e.g., Bjørlykke and Aagaard, 1992;
Draege et al., 2006; Ruud et al., 2003).
2.0
Stress sensitivity of compressional and shear velocities
1.5 and anisotropy parameters versus ORS maturity was also
15 20 25 30 35 40 45 50 investigated by Vernik with colleagues (Vernik, 1994; Vernik
Effective conning pressure (MPa) and Nur, 1992). Vernik and coauthors graphically demon
strated that velocity of the mature ORSs with a hydrogen
35 index (HI) below 200 exhibit much stronger nonlinear stress
30 sensitivity compared to immature and partially mature shales
with HI > 300. Vernik and coauthors explained stronger
25 E wet stress dependencies of the ultrasonic velocities in mature
Modulus (GPa) 20 G wet the maturation process generates microcracks that result in
shales with a hypothesis that pore pressure developed due to
E dry
G dry
K wet
stronger velocity dispersion in mature shales compared to
15
K dry
immature shales. It is worth noting that similar exponential
10
higher stresses was observed both in sandstones and shales
5 saturation of velocities at lower stresses to a linear trend at
and was explained by the closure of microcracks at low
0 stresses (e.g., Pervukhina et al., 2010, 2011; Shapiro, 2003).
15 20 25 30 35 40 45 50 Vanorio et al. (2008) reanalyzed the data from the dataset
Effective conning pressure (MPa)
compiled by Vernik and coauthors. Vanorio et al. (2008)
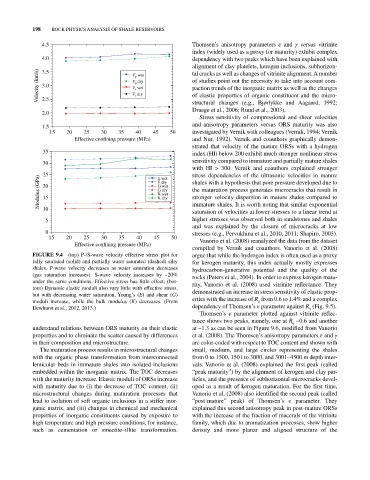
FIGURE 9.4 (top) P‐/S‐wave velocity effective stress plot for argue that while the hydrogen index is often used as a proxy
fully saturated (solid) and partially water saturated (dashed) silty for kerogen maturity, this index actually mostly expresses
shales. P‐wave velocity decreases as water saturation decreases hydrocarbon‐generative potential and the quality of the
(gas saturation increases). S‐wave velocity increases by ~20% rocks (Peters et al., 2004). In order to express kerogen matu
under the same conditions. Effective stress has little effect; (bot rity, Vanorio et al. (2008) used vitrinite reflectance. They
tom) Dynamic elastic moduli also vary little with effective stress,
but with decreasing water saturation, Young’s (E) and shear (G) demonstrated an increase in stress sensitivity of elastic prop
moduli increase, while the bulk modulus (K) decreases. (From erties with the increase of R from 0.6 to 1.4% and a complex
0
Dewhurst et al., 2012, 2013.) dependency of Thomsen’s ε parameter against R (Fig. 9.5).
0
Thomsen’s ε parameter plotted against vitrinite reflec
tance shows two peaks, namely, one at R ~0.6 and another
0
understand relations between ORS maturity on their elastic at ~1.3 as can be seen in Figure 9.6, modified from Vanorio
properties and to eliminate the scatter caused by differences et al. (2008). The Thomsen’s anisotropy parameters ε and γ
in their composition and microstructure. are color‐coded with respect to TOC content and shown with
The maturation process results in microstructural changes small, medium, and large circles representing the shales
with the organic phase transformation from interconnected from 0 to 1500, 1501 to 3000, and 3001–4500 m depth inter
lenticular beds in immature shales into isolated inclusions vals. Vanorio et al. (2008) explained the first peak (called
embedded within the inorganic matrix. The TOC decreases “peak maturity”) by the alignment of kerogen and clay par
with the maturity increase. Elastic moduli of ORSs increase ticles, and the presence of subhorizontal microcracks devel
with maturity due to (i) the decrease of TOC content, (ii) oped as a result of kerogen maturation. For the first time,
microstructural changes during maturation processes that Vanorio et al. (2008) also identified the second peak (called
lead to isolation of soft organic inclusions in a stiffer inor “post‐mature” peak) of Thomsen’s ε parameter. They
ganic matrix, and (iii) changes in chemical and mechanical explained this second anisotropy peak in post‐mature ORSs
properties of inorganic constituents caused by exposure to with the increase of the fraction of macerals of the vitrinite
high temperature and high pressure conditions, for instance, family, which due to aromatization processes, show higher
such as cementation or smectite–illite transformation. density and more planar and aligned structure of the