
Page 220 - Fundamentals of Gas Shale Reservoirs
P. 220
200 ROCK PHYSICS ANALYSIS OF SHALE RESERVOIRS
carbon‐rich rings. Vanorio et al. (2008) speculated that the (a)
intrinsic component of anisotropy in ORSs might be linked
to the aligned structure of vitrinite and, thus, the early mature
and mature shales with the peak in vitrinite composition
would have the strongest anisotropy. Vanorio et al. (2008) Velocities (km/s) V ph
compared the variation of P‐wave anisotropy as a function of V sv
maturity and the changes in organic matter composition that V pv
affect R and found that they follow the same trend and might V sh
0
have the same origin. At the same time, these two peaks are
hardly statistically separable as the drop of Thomsen’s ε at Temperature (ºC)
R = 0.88 is denoted with one measured point which mea
0
sured on a marl from a depth of 1121 m with a low fraction (b)
of TOC = 1.2%.
Studies described earlier explain changes in elastic prop
erties and anisotropy of ORSs with microstructural changes
(i.e., kerogen phase connectivity and/or microcrack develop E (GPa) E unload
ment) and variations in properties of kerogen phase. E load
Patrusheva et al. (2014) suggested that the process of matu
ration that takes place at high temperatures might also cause
changes in clay composition and its elastic properties. The Temperature (ºC)
authors measured static and dynamic moduli of cylindrical
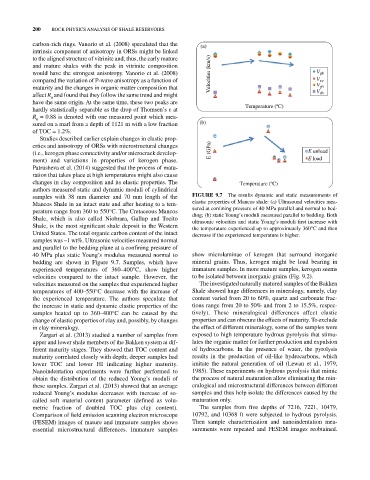
samples with 38 mm diameter and 70 mm length of the FIGURE 9.7 The results dynamic and static measurements of
Mancos Shale in an intact state and after heating to a tem elastic properties of Mancos shale: (a) Ultrasound velocities mea
perature range from 360 to 550°C. The Cretaceous Mancos sured at confining pressure of 40 MPa parallel and normal to bed
Shale, which is also called Niobrara, Gallup and Tocito ding; (b) static Young’s moduli measured parallel to bedding. Both
ultrasonic velocities and static Young’s moduli first increase with
Shale, is the most significant shale deposit in the Western the temperature experienced up to approximately 360°C and then
United States. The total organic carbon content of the intact decrease if the experienced temperature is higher.
samples was ~1 wt%. Ultrasonic velocities measured normal
and parallel to the bedding plane at a confining pressure of
40 MPa plus static Young’s modulus measured normal to show microlaminae of kerogen that surround inorganic
bedding are shown in Figure 9.7. Samples, which have mineral grains. Thus, kerogen might be load bearing in
experienced temperatures of 360–400°C, show higher immature samples. In more mature samples, kerogen seems
velocities compared to the intact sample. However, the to be isolated between inorganic grains (Fig. 9.2).
velocities measured on the samples that experienced higher The investigated naturally matured samples of the Bakken
temperatures of 400–550°C decrease with the increase of Shale showed huge differences in mineralogy, namely, clay
the experienced temperature. The authors speculate that content varied from 20 to 60%, quartz and carbonate frac
the increase in static and dynamic elastic properties of the tions range from 20 to 50% and from 2 to 15.5%, respec
samples heated up to 360–400°C can be caused by the tively). These mineralogical differences affect elastic
change of elastic properties of clay and, possibly, by changes properties and can obscure the effects of maturity. To exclude
in clay mineralogy. the effect of different mineralogy, some of the samples were
Zargari et al. (2013) studied a number of samples from exposed to high temperature hydrous pyrolysis that stimu
upper and lower shale members of the Bakken system at dif lates the organic matter for further production and expulsion
ferent maturity stages. They showed that TOC content and of hydrocarbons. In the presence of water, the pyrolysis
maturity correlated closely with depth; deeper samples had results in the production of oil‐like hydrocarbons, which
lower TOC and lower HI indicating higher maturity. imitate the natural generation of oil (Lewan et al., 1979,
Nanoindentation experiments were further performed to 1985). These experiments on hydrous pyrolysis that mimic
obtain the distribution of the reduced Young’s moduli of the process of natural maturation allow eliminating the min
these samples. Zargari et al. (2013) showed that an average eralogical and microstructural differences between different
reduced Young’s modulus decreases with increase of so‐ samples and thus help isolate the differences caused by the
called soft material content parameter (defined as volu maturation only.
metric fraction of doubled TOC plus clay content). The samples from five depths of 7216, 7221, 10479,
Comparison of field emission scanning electron microscope 10792, and 10368 ft were subjected to hydrous pyrolysis.
(FESEM) images of mature and immature samples shows Then sample characterization and nanoindentation mea
essential microstructural differences. Immature samples surements were repeated and FESEM images reobtained.