
Page 216 - Fundamentals of Gas Shale Reservoirs
P. 216
196 ROCK PHYSICS ANALYSIS OF SHALE RESERVOIRS
(a) (b)
Clays
Compliant micropores
Bedding conform kerogen
Kerogen globule Pyrobitumen
Compliant micropores
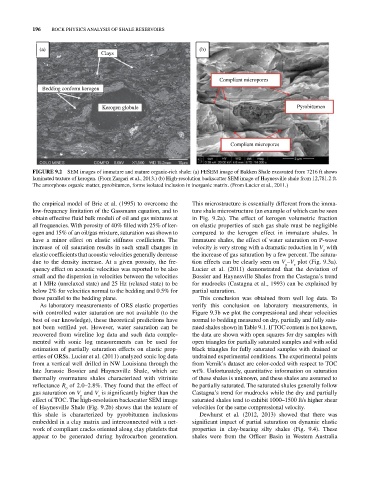
FIGURE 9.2 SEM images of immature and mature organic‐rich shale: (a) FESEM image of Bakken Shale excavated from 7216 ft shows
laminated texture of kerogen. (From Zargari et al., 2013.) (b) High‐resolution backscatter SEM image of Haynesville shale from 12,781.2 ft.
The amorphous organic matter, pyrobitumen, forms isolated inclusion in inorganic matrix. (From Lucier et al., 2011.)
the empirical model of Brie et al. (1995) to overcome the This microstructure is essentially different from the imma
low‐frequency limitation of the Gassmann equation, and to ture shale microstructure (an example of which can be seen
obtain effective fluid bulk moduli of oil and gas mixtures at in Fig. 9.2a). The effect of kerogen volumetric fraction
all frequencies. With porosity of 40% filled with 25% of ker on elastic properties of such gas shale must be negligible
ogen and 15% of an oil/gas mixture, saturation was shown to compared to the kerogen effect in immature shales. In
have a minor effect on elastic stiffness coefficients. The immature shales, the effect of water saturation on P‐wave
increase of oil saturation results in such small changes in velocity is very strong with a dramatic reduction in V with
p
elastic coefficients that acoustic velocities generally decrease the increase of gas saturation by a few percent. The satura
due to the density increase. At a given porosity, the fre tion effects can be clearly seen on V –V plot (Fig. 9.3a).
p
s
quency effect on acoustic velocities was reported to be also Lucier et al. (2011) demonstrated that the deviation of
small and the dispersion in velocities between the velocities Bossier and Haynesville Shales from the Castagna’s trend
at 1 MHz (unrelaxed state) and 25 Hz (relaxed state) to be for mudrocks (Castagna et al., 1993) can be explained by
below 2% for velocities normal to the bedding and 0.5% for partial saturation.
those parallel to the bedding plane. This conclusion was obtained from well log data. To
As laboratory measurements of ORS elastic properties verify this conclusion on laboratory measurements, in
with controlled water saturation are not available (to the Figure 9.3b we plot the compressional and shear velocities
best of our knowledge), these theoretical predictions have normal to bedding measured on dry, partially and fully satu
not been verified yet. However, water saturation can be rated shales shown in Table 9.1. If TOC content is not known,
recovered from wireline log data and such data comple the data are shown with open squares for dry samples with
mented with sonic log measurements can be used for open triangles for partially saturated samples and with solid
estimation of partially saturation effects on elastic prop black triangles for fully saturated samples with drained or
erties of ORSs. Lucier et al. (2011) analyzed sonic log data undrained experimental conditions. The experimental points
from a vertical well drilled in NW Louisiana through the from Vernik’s dataset are color‐coded with respect to TOC
late Jurassic Bossier and Haynesville Shale, which are wt%. Unfortunately, quantitative information on saturation
thermally overmature shales characterized with vitrinite of these shales is unknown, and these shales are assumed to
reflectance R of 2.0–2.8%. They found that the effect of be partially saturated. The saturated shales generally follow
0
gas saturation on V and V is significantly higher than the Castagna’s trend for mudrocks while the dry and partially
s
p
effect of TOC. The high‐resolution backscatter SEM image saturated shales tend to exhibit 1000–1500 ft/s higher shear
of Haynesville Shale (Fig. 9.2b) shows that the texture of velocities for the same compressional velocity.
this shale is characterized by pyrobitumen inclusions Dewhurst et al. (2012, 2013) showed that there was
embedded in a clay matrix and interconnected with a net significant impact of partial saturation on dynamic elastic
work of compliant cracks oriented along clay platelets that properties in clay‐bearing silty shales (Fig. 9.4). These
appear to be generated during hydrocarbon generation. shales were from the Officer Basin in Western Australia