
Page 266 - Fundamentals of Gas Shale Reservoirs
P. 266
246 GAS TRANSPORT PROCESSES IN SHALE
200 nm
200 m
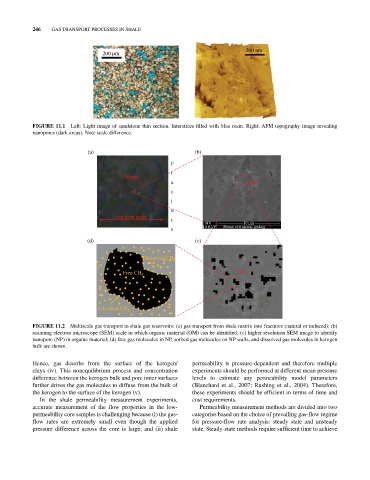
FIGURE 11.1 Left: Light image of sandstone thin section. Interstices filled with blue resin. Right: AFM topography image revealing
nanopores (dark areas). Note scale difference.
(a) (b)
F
r
Matrix
a OM
c
t
u
cm to m scale
r
HV 10 m
e 10.0 kV Bureau of economic geology
(d) (c)
Dissolved CH 4
Free CH 4 NP
Adsorbed CH 4
FIGURE 11.2 Multiscale gas transport in shale gas reservoirs: (a) gas transport from shale matrix into fractures (natural or induced); (b)
scanning electron microscope (SEM) scale in which organic material (OM) can be identified; (c) higher resolution SEM image to identify
nanopore (NP) in organic material; (d) free gas molecules in NP, sorbed gas molecules on NP walls, and dissolved gas molecules in kerogen
bulk are shown.
Hence, gas desorbs from the surface of the kerogen/ permeability is pressure‐dependent and therefore multiple
clays (iv). This nonequilibrium process and concentration experiments should be performed at different mean pressure
difference between the kerogen bulk and pore inner surfaces levels to estimate any permeability model parameters
further drives the gas molecules to diffuse from the bulk of (Blanchard et al., 2007; Rushing et al., 2004). Therefore,
the kerogen to the surface of the kerogen (v). these experiments should be efficient in terms of time and
In the shale permeability measurement experiments, cost requirements.
accurate measurement of the flow properties in the low‐ Permeability measurement methods are divided into two
permeability core samples is challenging because (i) the gas‐ categories based on the choice of prevailing gas‐flow regime
flow rates are extremely small even though the applied for pressure‐flow rate analysis: steady state and unsteady
pressure difference across the core is large; and (ii) shale state. Steady‐state methods require sufficient time to achieve