
Page 267 - Fundamentals of Gas Shale Reservoirs
P. 267
DETECTION OF NANOPORES IN SHALE SAMPLES 247
steady flow across the core sample. The unsteady methods scanning electron microscopy (SEM) (Loucks et al., 2012;
require a more complicated postprocessing because an Milliken et al., 2012) and atomic force microscopy (AFM)
accurate solution for the transient flow equation is required, (Javadpour et al., 2012). Mercury‐injection tests can reveal
and a reliable method for the estimation of the permeability pore‐throat size distribution in a shale sample, but extremely
model parameters should be developed. high pressure (>60,000 psi) are required. Another disadvan-
Permeability measurement experiments typically involve tage of mercury‐injection testing is that, in this process, the
a chronological recording pressure and/or flow rate response sample is destroyed and cannot be used for other tests.
under or after the application of a pressure perturbation Nitrogen‐adsorption testing can detect nanopores (Groen
signal across a core sample. Assuming a one‐dimensional et al., 2003). The method is based on condensation of the
flow with constant pressures applied to the upstream and nitrogen molecules in pores and a material balance of
downstream faces of a core sample, the required time to adsorbed nitrogen and nitrogen pressure in the system
achieve the steady flow condition is proportional to the (Barrett et al., 1951). Pore size is determined by measuring
squared sample length in the flow direction and inversely the volume of the nitrogen molecules condensed (adsorbed)
proportional to the intrinsic permeability. Considering that versus nitrogen pressure. Other gases such as carbon dioxide
the shale permeability typically falls in the micro‐Darcy (CO ) can also be used instead of nitrogen gas to reveal
2
down to nano‐Darcy range, a relatively long time is required sub‐nanopores.
to reach a steady‐state flow regime. Therefore, the steady‐ In SEM, a high‐energy beam of electrons is emitted to the
state flow regime experiments may not be good candidates surface and the reflected electrons reveal surface features,
for shale permeability measurement. such as nanopores. The limit of nanopore detection is about
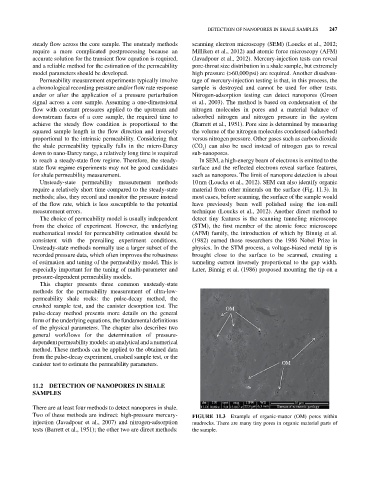
Unsteady‐state permeability measurement methods 10 nm (Loucks et al., 2012). SEM can also identify organic
require a relatively short time compared to the steady‐state material from other minerals on the surface (Fig. 11.3). In
methods; also, they record and monitor the pressure instead most cases, before scanning, the surface of the sample would
of the flow rate, which is less susceptible to the potential have previously been well polished using the ion‐mill
measurement errors. technique (Loucks et al., 2012). Another direct method to
The choice of permeability model is usually independent detect tiny features is the scanning tunneling microscope
from the choice of experiment. However, the underlying (STM), the first member of the atomic force microscope
mathematical model for permeability estimation should be (AFM) family, the introduction of which by Binnig et al.
consistent with the prevailing experiment conditions. (1982) earned those researchers the 1986 Nobel Prize in
Unsteady‐state methods normally use a larger subset of the physics. In the STM process, a voltage‐biased metal tip is
recorded pressure data, which often improves the robustness brought close to the surface to be scanned, creating a
of estimation and tuning of the permeability model. This is tunneling current inversely proportional to the gap width.
especially important for the tuning of multi‐parameter and Later, Binnig et al. (1986) proposed mounting the tip on a
pressure‐dependent permeability models.
This chapter presents three common unsteady‐state
methods for the permeability measurement of ultra‐low‐
permeability shale rocks: the pulse‐decay method, the
crushed sample test, and the canister desorption test. The OM
pulse‐decay method presents more details on the general
form of the underlying equations, the fundamental definitions
of the physical parameters. The chapter also describes two
general workflows for the determination of pressure‐
dependent permeability models: an analytical and a numerical
method. These methods can be applied to the obtained data
from the pulse‐decay experiment, crushed sample test, or the
canister test to estimate the permeability parameters. OM
11.2 DETECTION OF NANOPORES IN SHALE
SAMPLES
det HV spot mag HFW WD 10 m
There are at least four methods to detect nanopores in shale. TLD 10.0kv 3.0 13 007 × 22.9 m 6.3 mm Bureau of economic geology
Two of these methods are indirect: high‐pressure mercury‐ FIGURE 11.3 Example of organic‐matter (OM) pores within
injection (Javadpour et al., 2007) and nitrogen‐adsorption mudrocks. There are many tiny pores in organic material parts of
tests (Barrett et al., 1951); the other two are direct methods: the sample.