
Page 272 - Fundamentals of Gas Shale Reservoirs
P. 272
252 GAS TRANSPORT PROCESSES IN SHALE
Constant cross‐section model (CCM) (Fig. 11.9a): The
radii of the selected pore‐volume compensating pores
are enlarged to make up for the loss of volume. The
cross‐sectional area of the attached throats, however,
are kept constant. This manipulation does not affect
fluid flow; however, it becomes important in the
presence of desorption.
Enlarged cross‐section model (ECM) (Fig. 11.9b): In
addition to the sizes of the targeted pores, the sizes of
the adjacent throats were enlarged as well. This
method allowed for the overlap of the shrunk and
enlarged targeted pores and throats. Little difference
was observed between this model and CCM.
Z
Shrunk length model (SLM) (Fig. 11.9c): In this model,
X Y the throat lengths are shrunk as well. This procedure
deforms the bulk geometry and further amendments
are needed to compute gas permeability.
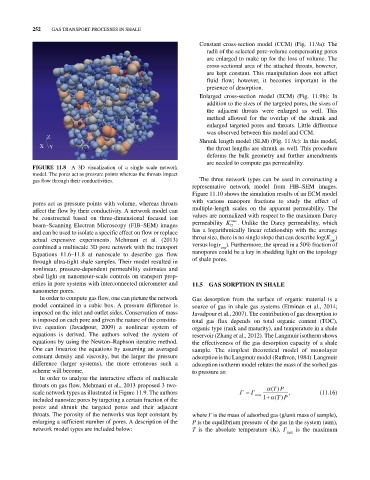
FIGURE 11.8 A 3D visualization of a single scale network
model. The pores act as pressure points whereas the throats impact
gas flow through their conductivities. The three network types can be used in constructing a
representative network model from FIB–SEM images.
Figure 11.10 shows the simulation results of an ECM model
pores act as pressure points with volume, whereas throats with various nanopore fractions to study the effect of
affect the flow by their conductivity. A network model can multiple‐length scales on the apparent permeability. The
be constructed based on three‐dimensional focused ion values are normalized with respect to the maximum Darcy
max
beam–Scanning Electron Microscopy (FIB–SEM) images permeability K D . Unlike the Darcy permeability, which
and can be used to isolate a specific effect on flow or replace has a logarithmically linear relationship with the average
actual expensive experiments. Mehmani et al. (2013) throat size, there is no single slope that can describe log(K )
app
combined a multiscale 3D pore network with the transport versus log(r ). Furthermore, the spread in a 50% fraction of
avg
Equations 11.6–11.8 at nanoscale to describe gas flow nanopores could be a key in shedding light on the topology
through ultra‐tight shale samples. Their model resulted in of shale pores.
nonlinear, pressure‐dependent permeability estimates and
shed light on nanometer‐scale controls on transport prop-
erties in pore systems with interconnected micrometer and 11.5 GAS SORPTION IN SHALE
nanometer pores.
In order to compute gas flow, one can picture the network Gas desorption from the surface of organic material is a
model contained in a cubic box. A pressure difference is source of gas in shale gas systems (Etminan et al., 2014;
imposed on the inlet and outlet sides. Conservation of mass Javadpour et al., 2007). The contribution of gas desorption to
is imposed on each pore and given the nature of the constitu- total gas flux depends on total organic content (TOC),
tive equation (Javadpour, 2009) a nonlinear system of organic type (rank and maturity), and temperature in a shale
equations is derived. The authors solved the system of reservoir (Zhang et al., 2012). The Langmuir isotherm shows
equations by using the Newton–Raphson iterative method. the effectiveness of the gas desorption capacity of a shale
One can linearize the equations by assuming an averaged sample. The simplest theoretical model of monolayer
constant density and viscosity, but the larger the pressure adsorption is the Langmuir model (Ruthven, 1984). Langmuir
difference (larger systems), the more erroneous such a adsorption isotherm model relates the mass of the sorbed gas
scheme will become. to pressure as:
In order to analyze the interactive effects of multiscale
throats on gas flow, Mehmani et al., 2013 proposed 3 two‐ ()TP
scale network types as illustrated in Figure 11.9. The authors max , (11.16)
included nanosize pores by targeting a certain fraction of the 1 ()TP
pores and shrunk the targeted pores and their adjacent
throats. The porosity of the networks was kept constant by where Γ is the mass of adsorbed gas (g/unit mass of sample),
enlarging a sufficient number of pores. A description of the P is the equilibrium pressure of the gas in the system (atm),
network model types are included below: T is the absolute temperature (K), Γ is the maximum
max