
Page 275 - Fundamentals of Gas Shale Reservoirs
P. 275
MEASUREMENT OF GAS MOLECULAR DIFFUSION INTO KEROGEN 255
90 Z
m Kerogen
80
*
70 C g
Adsorbed methane (scf/ton) 50 Nanopone C g0
60
40
30
20 h
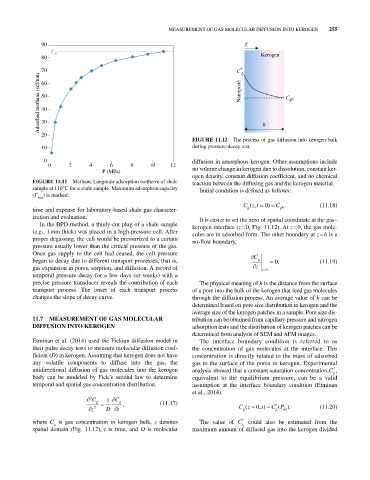
FIGURE 11.12 The process of gas diffusion into kerogen bulk
10 during pressure‐decay test.
0 diffusion in amorphous kerogen. Other assumptions include
0 2 4 6 8 10 12
P (MPa) no volume change in kerogen due to dissolution, constant ker-
ogen density, constant diffusion coefficient, and no chemical
FIGURE 11.11 Methane Langmuir adsorption isotherm of shale reaction between the diffusing gas and the kerogen material.
sample at 110°C for a shale sample. Maximum adsorption capacity Initial condition is defined as follows:
(Γ ) is marked.
max
,
Cz t ) 0 C . (11.18)
(
time and expense for laboratory‐based shale gas character- g g0
ization and evaluation. It is easier to set the zero of spatial coordinate at the gas–
In the BPD method, a thinly‐cut plug of a shale sample kerogen interface (z = 0, Fig. 11.12). At z = 0, the gas mole-
(e.g., 1 mm thick) was placed in a high‐pressure cell. After cules are in adsorbed form. The other boundary at z = h is a
proper degassing, the cell would be pressurized to a certain no‐flow boundary,
pressure usually lower than the critical pressure of the gas.
Once gas supply to the cell had ceased, the cell pressure C
began to decay due to different transport processes, that is, g . 0 (11.19)
gas expansion in pores, sorption, and diffusion. A record of z zh
temporal pressure decay for a few days (or weeks) with a
precise pressure transducer reveals the contribution of each The physical meaning of h is the distance from the surface
transport process. The onset of each transport process of a pore into the bulk of the kerogen that feed gas molecules
changes the slope of decay curve. through the diffusion process. An average value of h can be
determined based on pore size distribution in kerogen and the
average size of the kerogen patches in a sample. Pore size dis-
11.7 MEASUREMENT OF GAS MOLECULAR tribution can be obtained from capillary pressure and nitrogen
DIFFUSION INTO KEROGEN adsorption tests and the distribution of kerogen patches can be
determined from analysis of SEM and AFM images.
Etminan et al. (2014) used the Fickian diffusion model in The interface boundary condition is referred to as
their pulse decay tests to measure molecular diffusion coef- the concentration of gas molecules at the interface. This
ficient (D) in kerogen. Assuming that kerogen does not have concentration is directly related to the mass of adsorbed
any volatile components to diffuse into the gas, the gas to the surface of the pores in kerogen. Experimental
*
unidirectional diffusion of gas molecules into the kerogen analysis showed that a constant saturation concentration,C ,
g
body can be modeled by Fick’s second law to determine equivalent to the equilibrium pressure, can be a valid
temporal and spatial gas concentration distribution. assumption at the interface boundary condition (Etminan
et al., 2014).
2 C
g 1 C g , (11.17) *
(
)
(
z 2 D t Cz , 0 t) C P . (11.20)
g
g
eq
where C is gas concentration in kerogen bulk, z denotes The value of C could also be estimated from the
*
g
g
spatial domain (Fig. 11.12), t is time, and D is molecular maximum amount of diffused gas into the kerogen divided