
Page 268 - Fundamentals of Gas Shale Reservoirs
P. 268
248 GAS TRANSPORT PROCESSES IN SHALE
cantilever spring and monitoring the cantilever deflection mean pressure in the system, that is, between gas‐flux
corresponding to tip‐surface forces, inventing AFM in the reduction and mean pressure increase.
process. Because the force between tip and surface is a
function of gap width, the AFM feedback system can b
maintain a steady gap between tip and surface by vertical tip kp ( m ) k D 1 p , (11.1)
displacement compensating for cantilever deflection. This m
technique allows topographic imaging of any material, either where k(p ) is gas permeability at mean pressure (p ). The
m
m
conductive or nonconductive. empirical parameters b and k are the slope and intercept of
D
The AFM scanner‐head system comprises a tip attached the fitted line through the k(p ) versus 1/p data. The inter-
m
to the end of a cantilever, a chip holder, a laser source, a cept k is the intrinsic permeability or liquid permeability of
m
D
mirror, a quadrant photodiode, and the controlling system the sample, that is, 1/p → 0 as p → ∞. The Klinkenberg
m
m
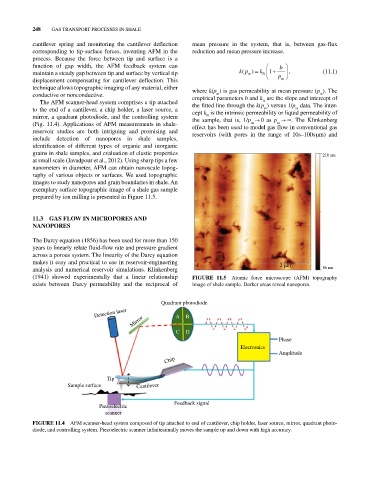
(Fig. 11.4). Applications of AFM measurements in shale‐ effect has been used to model gas flow in conventional gas
reservoir studies are both intriguing and promising and reservoirs (with pores in the range of 10s–100s µm) and
include detection of nanopores in shale samples,
identification of different types of organic and inorganic
grains in shale samples, and evaluation of elastic properties 210 nm
at small scale (Javadpour et al., 2012). Using sharp tips a few
nanometers in diameter, AFM can obtain nanoscale topog-
raphy of various objects or surfaces. We used topographic
images to study nanopores and grain boundaries in shale. An
exemplary surface topographic image of a shale gas sample
prepared by ion milling is presented in Figure 11.5.
11.3 GAS FLOW IN MICROPORES AND
NANOPORES
The Darcy equation (1856) has been used for more than 150
years to linearly relate fluid‐flow rate and pressure gradient
across a porous system. The linearity of the Darcy equation
makes it easy and practical to use in reservoir‐engineering 2 m
analysis and numerical reservoir simulations. Klinkenberg 86 nm
(1941) showed experimentally that a linear relationship FIGURE 11.5 Atomic force microscope (AFM) topography
exists between Darcy permeability and the reciprocal of image of shale sample. Darker areas reveal nanopores.
Quadrant photodiode
Detection laser A B
Mirror
C D
Phase
Electronics
Amplitude
Chip
Tip
Sample surface Cantilever
Feedback signal
Piezoelectric
scanner
FIGURE 11.4 AFM scanner‐head system composed of tip attached to end of cantilever, chip holder, laser source, mirror, quadrant photo-
diode, and controlling system. Piezoelectric scanner infinitesimally moves the sample up and down with high accuracy.