
Page 338 - Fundamentals of Gas Shale Reservoirs
P. 338
318 RESOURCE ESTIMATION FOR SHALE GAS RESERVOIRS
Using known estimated productive acreage of each shale gas repeated to determine the ratio ERR/TRR over a range of gas
play, Dong et al. (2014) also estimated the OGIP and TRR prices and F&DC (Figs. 14.23, 14.24, 14.25, and 14.26). For
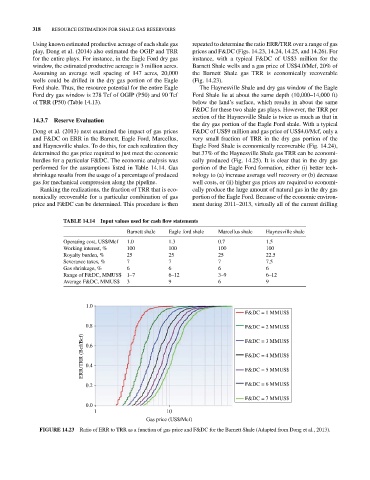
for the entire plays. For instance, in the Eagle Ford dry gas instance, with a typical F&DC of US$3 million for the
window, the estimated productive acreage is 3 million acres. Barnett Shale wells and a gas price of US$4.0/Mcf, 20% of
Assuming an average well spacing of 147 acres, 20,000 the Barnett Shale gas TRR is economically recoverable
wells could be drilled in the dry gas portion of the Eagle (Fig. 14.23).
Ford shale. Thus, the resource potential for the entire Eagle The Haynesville Shale and dry gas window of the Eagle
Ford dry gas window is 278 Tcf of OGIP (P50) and 90 Tcf Ford Shale lie at about the same depth (10,000–14,000 ft)
of TRR (P50) (Table 14.13). below the land’s surface, which results in about the same
F&DC for these two shale gas plays. However, the TRR per
section of the Haynesville Shale is twice as much as that in
14.3.7 Reserve Evaluation
the dry gas portion of the Eagle Ford shale. With a typical
Dong et al. (2013) next examined the impact of gas prices F&DC of US$9 million and gas price of US$4.0/Mcf, only a
and F&DC on ERR in the Barnett, Eagle Ford, Marcellus, very small fraction of TRR in the dry gas portion of the
and Haynesville shales. To do this, for each realization they Eagle Ford Shale is economically recoverable (Fig. 14.24),
determined the gas price required to just meet the economic but 37% of the Haynesville Shale gas TRR can be economi-
hurdles for a particular F&DC. The economic analysis was cally produced (Fig. 14.25). It is clear that in the dry gas
performed for the assumptions listed in Table 14.14. Gas portion of the Eagle Ford formation, either (i) better tech-
shrinkage results from the usage of a percentage of produced nology to (a) increase average well recovery or (b) decrease
gas for mechanical compression along the pipeline. well costs, or (ii) higher gas prices are required to economi-
Ranking the realizations, the fraction of TRR that is eco- cally produce the large amount of natural gas in the dry gas
nomically recoverable for a particular combination of gas portion of the Eagle Ford. Because of the economic environ-
price and F&DC can be determined. This procedure is then ment during 2011–2013, virtually all of the current drilling
TAbLE 14.14 Input values used for cash flow statements
Barnett shale Eagle ford shale Marcellus shale Haynesville shale
Operating cost, US$/Mcf 1.0 1.3 0.7 1.5
Working interest, % 100 100 100 100
Royalty burden, % 25 25 25 22.5
Severance taxes, % 7 7 7 7.5
Gas shrinkage, % 6 6 6 6
Range of F&DC, MMUS$ 1–7 6–12 3–9 6–12
Average F&DC, MMUS$ 3 9 6 9
1.0
F&DC=1 MMUS$
0.8 F&DC=2 MMUS$
ERR/TRR (Bcf/Bcf) 0.6 F&DC=3 MMUS$
F&DC=4 MMUS$
0.4
F&DC=5 MMUS$
0.2 F&DC=6 MMUS$
F&DC=7 MMUS$
0.0
1 10
Gas price (US$/Mcf)
FIGURE 14.23 Ratio of ERR to TRR as a function of gas price and F&DC for the Barnett Shale (Adapted from Dong et al., 2013).