
Page 334 - Fundamentals of Gas Shale Reservoirs
P. 334
314 RESOURCE ESTIMATION FOR SHALE GAS RESERVOIRS
100
80
Percentile (%) 60
40
20 Field data
Simulation result
0
0 0.6 1.2 1.8 2.4 3.0
1-year cumulative production (Bcf/well)
FIGURE 14.14 Probability distribution of cumulative gas production (1‐year) match result for the Marcellus Shale (Adapted from Dong
et al., 2014).
100
80
Percentile (%) 60
40
20 Field data
Simulation result
0
0 1.0 2.0 3.0 4.0 5.0 6.0 7.0
2-year cumulative production (Bcf/well)
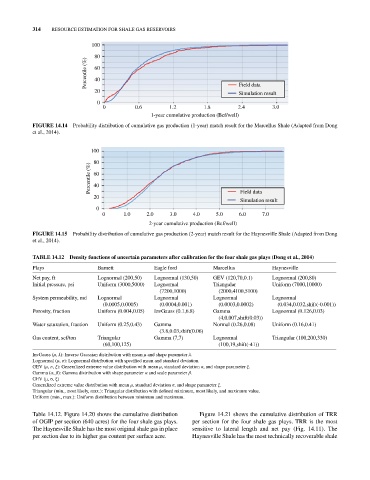
FIGURE 14.15 Probability distribution of cumulative gas production (2‐year) match result for the Haynesville Shale (Adapted from Dong
et al., 2014).
TAbLE 14.12 Density functions of uncertain parameters after calibration for the four shale gas plays (Dong et al., 2014)
Plays Barnett Eagle ford Marcellus Haynesville
Net pay, ft Lognormal (200,50) Lognormal (130,50) GEV (120,70,0.1) Lognormal (200,80)
Initial pressure, psi Uniform (3000,5000) Lognormal Triangular Uniform (7000,10000)
(7200,1000) (2000,4100,5100)
System permeability, md Lognormal Lognormal Lognormal Lognormal
(0.0005,0.0005) (0.0004,0.001) (0.0003,0.0002) (0.034,0.032,shift(‐0.001))
Porosity, fraction Uniform (0.004,0.05) InvGauss (0.1,6.8) Gamma Lognormal (0.126,0.03)
(4,0.007,shift(0.03))
Water saturation, fraction Uniform (0.25,0.43) Gamma Normal (0.26,0.08) Uniform (0.16,0.41)
(3.8,0.03,shift(0.06)
Gas content, scf/ton Triangular Gamma (7,7) Lognormal Triangular (100,200,330)
(60,100,125) (100,19,shift(‐41))
InvGauss (μ, λ): Inverse Gaussian distribution with mean μ and shape parameter λ.
Lognormal (μ, σ): Lognormal distribution with specified mean and standard deviation.
GEV (μ, σ, ξ): Generalized extreme value distribution with mean μ, standard deviation σ, and shape parameter ξ.
Gamma (α, β): Gamma distribution with shape parameter α and scale parameter β.
GEV (μ, σ, ξ)
Generalized extreme value distribution with mean μ, standard deviation σ, and shape parameter ξ.
Triangular (min., most likely, max.): Triangular distribution with defined minimum, most likely, and maximum value.
Uniform (min., max.): Uniform distribution between minimum and maximum.
Table 14.12. Figure 14.20 shows the cumulative distribution Figure 14.21 shows the cumulative distribution of TRR
of OGIP per section (640 acres) for the four shale gas plays. per section for the four shale gas plays. TRR is the most
The Haynesville Shale has the most original shale gas in place sensitive to lateral length and net pay (Fig. 14.11). The
per section due to its higher gas content per surface acre. Haynesville Shale has the most technically recoverable shale