
Page 332 - Fundamentals of Gas Shale Reservoirs
P. 332
312 RESOURCE ESTIMATION FOR SHALE GAS RESERVOIRS
permeability, porosity, water saturation, and gas content as the ranges listed in Table 14.10. They did not consider pos-
uncertain parameters. sible correlations among these parameters. Some or all of
these density functions were refined until a reasonable match
between the simulated and the actual cumulative distribution
14.3.4 Reservoir Parameters
of cumulative gas production was obtained (Figs. 14.12,
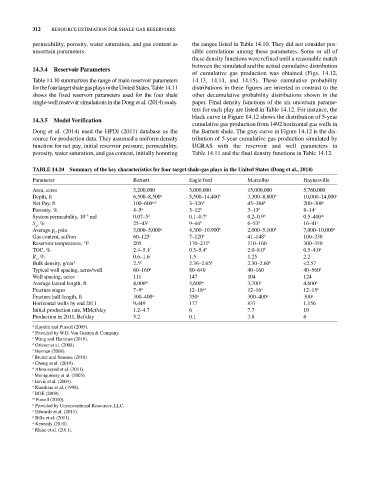
Table 14.10 summarizes the range of main reservoir parameters 14.13, 14.14, and 14.15). These cumulative probability
for the four target shale gas plays in the United States. Table 14.11 distributions in these figures are inverted in contrast to the
shows the fixed reservoir parameters used for the four shale other decumulative probability distributions shown in the
single‐well reservoir simulations in the Dong et al. (2014) study. paper. Final density functions of the six uncertain parame-
ters for each play are listed in Table 14.12. For instance, the
black curve in Figure 14.12 shows the distribution of 5‐year
14.3.5 Model Verification
cumulative gas production from 1492 horizontal gas wells in
Dong et al. (2014) used the HPDI (2011) database as the the Barnett shale. The gray curve in Figure 14.12 is the dis-
source for production data. They assumed a uniform density tribution of 5‐year cumulative gas production simulated by
function for net pay, initial reservoir pressure, permeability, UGRAS with the reservoir and well parameters in
porosity, water saturation, and gas content, initially honoring Table 14.11 and the final density functions in Table 14.12.
TAbLE 14.10 Summary of the key characteristics for four target shale‐gas plays in the United States (Dong et al., 2014)
Parameter Barnett Eagle ford Marcellus Haynesville
Area, acres 3,200,000 3,000,000 15,000,000 5,760,000
Depth, ft 6,500–8,500 a 5,500–14,400 b 3,300–8,800 b 10,000–14,000 c
Net Pay, ft 100–600 a,d 3–326 b 45–384 b 200–300 e
Porosity, % 4–5 a 3–12 b 3–13 b 8–14 e
System permeability, 10 md 0.07–5 d 0.1–0.7 b 0.2–0.9 b 0.5–400*
–3
S , % 25–43 f 9–44 b 6–53 b 16–41 c
w
Average p , psia 3,000–5,000 g 4,300–10,900 b 2,000–5,100 b 7,000–10,000 h
i
Gas content, scf/ton 60–125 i 7–120 b 41–148 b 100–330
Reservoir temperature, °F 205 170–231 b 110–160 300–350
TOC, % 2.4–5.1 f 0.3–5.4 b 2.0–8.0 b 0.5–4.0 e
R , % 0.6–1.6 j 1.5 1.25 2.2
o
Bulk density, g/cm 3 2.5 k 2.36–2.65 b 2.30–2.60 b <2.57
Typical well spacing, acres/well 60–160 a 80–640 40–160 40–560 l
Well spacing, acres 111 147 104 124
Average lateral length, ft 4,000 m 5,600 m 3,700 o 4,600 p
Fracture stages 7–9 q 12–18 q,r 12–16 o 12–15 p
Fracture half‐length, ft 300–400 q 350 q 300–400 q 300 q
Horizontal wells by end 2011 9,449 177 837 1,156
Initial production rate, MMcf/day 1.2–4.7 6 7.7 10
Production in 2011, Bcf/day 5.2 0.1 3.8 6
a Hayden and Pursell (2005).
b Provided by W.D. Von Gonten & Company.
c Wang and Hammes (2010).
d Grieser et al. (2008).
e Berman (2008).
f Bruner and Smosna (2010).
g Chong et al. (2010).
h Abou‐sayed et al. (2011).
i Montgomery et al. (2005).
j Jarvie et al. (2004).
k Kuuskraa et al. (1998).
l DOE (2009).
m Powell (2010).
n Provided by Unconventional Resources, LLC.
o Edwards et al. (2011).
p Billa et al. (2011).
q Kennedy (2010).
r Rhine et al. (2011).