Page 337 - Fundamentals of Gas Shale Reservoirs
P. 337

RESOURCE EVALUATION OF SHALE GAS PLAYS  317
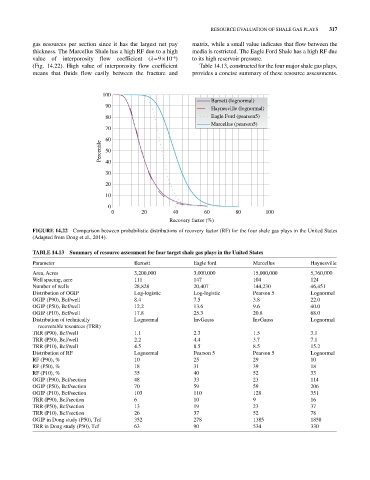
            gas resources per section since it has the largest net pay   matrix, while a small value indicates that flow between the
            thickness. The Marcellus Shale has a high RF due to a high   media is restricted. The Eagle Ford Shale has a high RF due
                                                          –6
            value of interporosity flow coefficient (λ = 9 × 10 )   to its high reservoir pressure.
            (Fig.  14.22). High  value  of interporosity  flow coefficient   Table 14.13, constructed for the four major shale gas plays,
            means that fluids flow easily between the fracture and   provides a concise summary of these resource assessments.


                                   100
                                                                       Barnett (lognormal)
                                    90                                 Haynesville (lognormal)

                                    80                                 Eagle Ford (pearson5)
                                                                       Marcellus (pearson5)
                                    70
                                    60
                                  Percentile  50


                                    40
                                    30
                                    20

                                    10
                                     0
                                      0         20        40         60        80        100
                                                         Recovery factor (%)
            FIGURE 14.22  Comparison between probabilistic distributions of recovery factor (RF) for the four shale gas plays in the United States
            (Adapted from Dong et al., 2014).

            TAbLE 14.13  Summary of resource assessment for four target shale gas plays in the United States

            Parameter                        Barnett             Eagle ford          Marcellus          Haynesville
            Area, Acres                      3,200,000           3,000,000           15,000,000         5,760,000
            Well spacing, acre               111                 147                 104                124
            Number of wells                  28,828              20,407              144,230            46,451
            Distribution of OGIP             Log‐logistic        Log‐logistic        Pearson 5          Lognormal
            OGIP (P90), Bcf/well             8.4                 7.5                 3.8                22.0
            OGIP (P50), Bcf/well             12.2                13.6                9.6                40.0
            OGIP (P10), Bcf/well             17.8                25.3                20.8               68.0
            Distribution of technically      Lognormal           InvGauss            InvGauss           Lognormal
              recoverable resources (TRR)
            TRR (P90), Bcf/well              1.1                 2.3                 1.5                3.1
            TRR (P50), Bcf/well              2.2                 4.4                 3.7                7.1
            TRR (P10), Bcf/well              4.5                 8.5                 8.5                15.2
            Distribution of RF               Lognormal           Pearson 5           Pearson 5          Lognormal
            RF (P90), %                      10                  25                  29                 10
            RF (P50), %                      18                  31                  39                 18
            RF (P10), %                      35                  40                  52                 33
            OGIP (P90), Bcf/section          48                  33                  23                 114
            OGIP (P50), Bcf/section          70                  59                  59                 206
            OGIP (P10), Bcf/section          103                 110                 128                351
            TRR (P90), Bcf/section           6                   10                  9                  16
            TRR (P50), Bcf/section           13                  19                  23                 37
            TRR (P10), Bcf/section           26                  37                  52                 78
            OGIP in Dong study (P50), Tcf    352                 278                 1385               1858
            TRR in Dong study (P50), Tcf     63                  90                  534                330
   332   333   334   335   336   337   338   339   340   341   342