
Page 333 - Fundamentals of Gas Shale Reservoirs
P. 333
RESOURCE EVALUATION OF SHALE GAS PLAYS 313
TAbLE 14.11 Fixed reservoir parameters for the shale‐gas reservoir simulation (Dong et al., 2014)
Parameters Barnett Eagle ford Marcellus Haynesville
°
Reservoir temperature, F 205 293 144 340
Bottom hole pressure, psia 500 500 500 500
Reservoir length, ft 4800 6400 4500 5400
Reservoir width, ft 1000 1000 1000 1000
Bulk density, g/cc 2.5 2.51 2.53 2.5
Fracture half‐length, ft 350 350 300 300
Lateral length of horizontal well, ft 4000 5600 3700 4600
Fracture stages 10 18 12 13
Langmuir pressure, psia 1241 1000 850 1000
Langmuir volume, scf/ton 150 60 100 380
λ (dimensionless) 7 × 10 –7 1 × 10 –6 7 × 10 –6 1 × 10 –8
ω (dimensionless) 0.01 0.01 0.01 0.01
100
80
Percentile (%) 60
40
20 Field data
Simulation result
0
0 1 2 3 4 5
5-year cumulative production (Bcf/well)
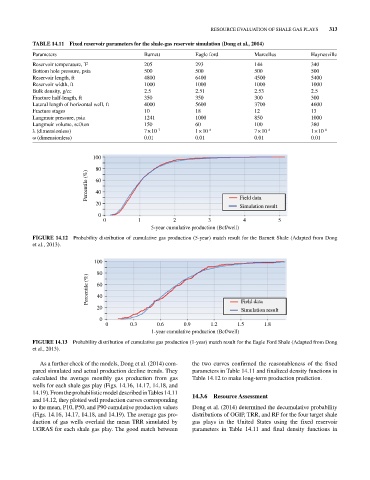
FIGURE 14.12 Probability distribution of cumulative gas production (5‐year) match result for the Barnett Shale (Adapted from Dong
et al., 2013).
100
80
Percentile (%) 60
40
20 Field data
Simulation result
0
0 0.3 0.6 0.9 1.2 1.5 1.8
1-year cumulative production (Bcf/well)
FIGURE 14.13 Probability distribution of cumulative gas production (1‐year) match result for the Eagle Ford Shale (Adapted from Dong
et al., 2013).
As a further check of the models, Dong et al. (2014) com- the two curves confirmed the reasonableness of the fixed
pared simulated and actual production decline trends. They parameters in Table 14.11 and finalized density functions in
calculated the average monthly gas production from gas Table 14.12 to make long‐term production prediction.
wells for each shale gas play (Figs. 14.16, 14.17, 14.18, and
14.19). From the probabilistic model described in Tables 14.11 14.3.6 Resource Assessment
and 14.12, they plotted well production curves corresponding
to the mean, P10, P50, and P90 cumulative production values Dong et al. (2014) determined the decumulative probability
(Figs. 14.16, 14.17, 14.18, and 14.19). The average gas pro- distributions of OGIP, TRR, and RF for the four target shale
duction of gas wells overlaid the mean TRR simulated by gas plays in the United States using the fixed reservoir
UGRAS for each shale gas play. The good match between parameters in Table 14.11 and final density functions in