Page 328 - Fundamentals of Gas Shale Reservoirs
P. 328

308   RESOURCE ESTIMATION FOR SHALE GAS RESERVOIRS


                                                    History  Projection
                               35

                               30
                              U.S. Gas Consumption (Tcf )  20  32%  Net import
                               25
                                                        8%

                                                            Shale gas
                               15
                                                       23%
                                                            Tight gas
                               10

                                5                       8%  Coalbed methane
                                                       29%  Conventional gas
                                0
                                1990  1995  2000  2005  2010  2015  2020  2025  2030  2035  2040
                                                              Year
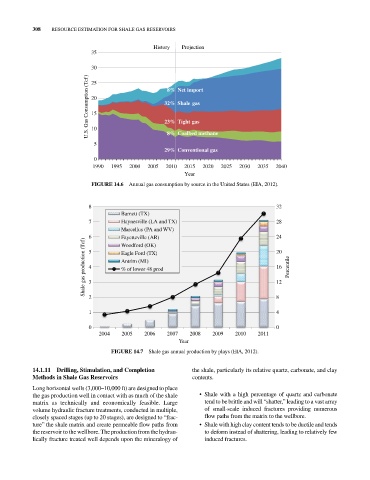
                               FIGURE 14.6  Annual gas consumption by source in the United States (EIA, 2012).


                              8                                                             32
                                          arnett (TX
                                         B
                                         Barnett (TX) )
                                         Haynesville (LA and TX)
                              7          Haynesville (LA and TX)                            28
                                         Marcellus (PA and WV)
                                         Marcellus (PA and WV)
                              6 5        Fayetteville (AR)                                  24
                                         Fayetteville (AR)
                             Shale gas production (Tcf)  4 3  Eagle Ford (TX)               16   Percentile
                                         Woodford (OK)
                                         Woodford (OK)
                                                                                            20
                                         Eagle Ford (TX)
                                         Antrim (MI)
                                         Antrim (MI)
                                         % of lower 48 prod
                                         % of lower 48 prod
                                                                                            12

                              1 2                                                           8
                                                                                            4
                              0                                                             0
                                  2004   2005    2006   2007    2008   2009    2010   2011
                                                            Year
                                      FIGURE 14.7  Shale gas annual production by plays (EIA, 2012).


            14.1.11  Drilling, Stimulation, and Completion       the shale, particularly its relative quartz, carbonate, and clay
            Methods in Shale Gas Reservoirs                      contents.
            Long horizontal wells (3,000–10,000 ft) are designed to place
            the gas production well in contact with as much of the shale     • Shale with a high percentage of quartz and carbonate
            matrix as technically and economically feasible. Large   tend to be brittle and will “shatter,” leading to a vast array
            volume hydraulic fracture treatments, conducted in multiple,   of small‐scale induced fractures providing numerous
            closely spaced stages (up to 20 stages), are designed to “frac-  flow paths from the matrix to the wellbore.
            ture” the shale matrix and create permeable flow paths from     • Shale with high clay content tends to be ductile and tends
            the reservoir to the wellbore. The production from the hydrau-  to deform instead of shattering, leading to relatively few
            lically fracture treated well depends upon the mineralogy of   induced fractures.
   323   324   325   326   327   328   329   330   331   332   333