
Page 324 - Fundamentals of Gas Shale Reservoirs
P. 324
304 RESOURCE ESTIMATION FOR SHALE GAS RESERVOIRS
14.1.8 Region‐Level World Shale Gas Resource OGIP was estimated to be between 34,000 (P90) and 73,000
Assessments
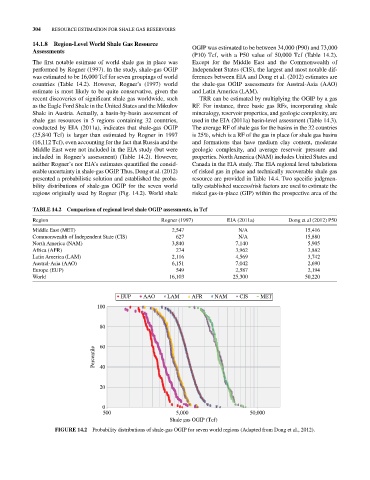
(P10) Tcf, with a P50 value of 50,000 Tcf (Table 14.2).
The first notable estimate of world shale gas in place was Except for the Middle East and the Commonwealth of
performed by Rogner (1997). In the study, shale‐gas OGIP Independent States (CIS), the largest and most notable dif-
was estimated to be 16,000 Tcf for seven groupings of world ferences between EIA and Dong et al. (2012) estimates are
countries (Table 14.2). However, Rogner’s (1997) world the shale‐gas OGIP assessments for Austral‐Asia (AAO)
estimate is most likely to be quite conservative, given the and Latin America (LAM).
recent discoveries of significant shale gas worldwide, such TRR can be estimated by multiplying the OGIP by a gas
as the Eagle Ford Shale in the United States and the Mikulov RF. For instance, three basic gas RFs, incorporating shale
Shale in Austria. Actually, a basin‐by‐basin assessment of mineralogy, reservoir properties, and geologic complexity, are
shale gas resources in 5 regions containing 32 countries, used in the EIA (2011a) basin‐level assessment (Table 14.3).
conducted by EIA (2011a), indicates that shale‐gas OGIP The average RF of shale gas for the basins in the 32 countries
(25,840 Tcf) is larger than estimated by Rogner in 1997 is 25%, which is a RF of the gas in place for shale gas basins
(16,112 Tcf), even accounting for the fact that Russia and the and formations that have medium clay content, moderate
Middle East were not included in the EIA study (but were geologic complexity, and average reservoir pressure and
included in Rogner’s assessment) (Table 14.2). However, properties. North America (NAM) includes United States and
neither Rogner’s nor EIA’s estimates quantified the consid- Canada in the EIA study. The EIA regional level tabulations
erable uncertainty in shale‐gas OGIP. Thus, Dong et al. (2012) of risked gas in place and technically recoverable shale gas
presented a probabilistic solution and established the proba- resource are provided in Table 14.4. Two specific judgmen-
bility distributions of shale‐gas OGIP for the seven world tally established success/risk factors are used to estimate the
regions originally used by Rogner (Fig. 14.2). World shale risked gas‐in‐place (GIP) within the prospective area of the
TAbLE 14.2 Comparison of regional level shale OGIP assessments, in Tcf
Region Rogner (1997) EIA (2011a) Dong et al (2012) P50
Middle East (MET) 2,547 N/A 15,416
Commonwealth of Independent State (CIS) 627 N/A 15,880
North America (NAM) 3,840 7,140 5,905
Africa (AFR) 274 3,962 3,882
Latin America (LAM) 2,116 4,569 3,742
Austral‐Asia (AAO) 6,151 7,042 2,690
Europe (EUP) 549 2,587 2,194
World 16,103 25,300 50,220
EUP AAO LAM AFR NAM CIS MET
100
80
Percentile 60
40
20
0
500 5,000 50,000
Shale gas OGIP (Tcf)
FIGURE 14.2 Probability distributions of shale‐gas OGIP for seven world regions (Adapted from Dong et al., 2012).