Page 325 - Fundamentals of Gas Shale Reservoirs
P. 325

INTRODUCTION    305
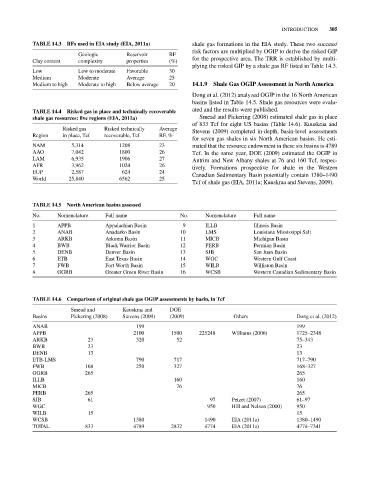
            TAbLE 14.3  RFs used in EIA study (EIA, 2011a)       shale gas formations in the EIA study. These two success/
                                                                 risk factors are multiplied by OGIP to derive the risked GIP
                           Geologic        Reservoir     RF
            Clay content   complexity      properties    (%)     for the prospective area. The TRR is established by multi-
                                                                 plying the risked GIP by a shale gas RF listed in Table 14.3.
            Low            Low to moderate  Favorable    30
            Medium         Moderate        Average       25
            Medium to high  Moderate to high  Below average  20  14.1.9  Shale Gas OGIP Assessment in North America
                                                                 Dong et al. (2012) analyzed OGIP in the 16 North American
                                                                 basins listed in Table 14.5. Shale gas resources were evalu-
            TAbLE 14.4  Risked gas in place and technically recoverable   ated and the results were published.
            shale gas resources: five regions (EIA, 2011a)         Smead and Pickering (2008) estimated shale gas in place
                                                                 of 833 Tcf for eight US basins (Table 14.6). Kuuskraa and
                      Risked gas    Risked technically   Average   Stevens (2009) completed in‐depth, basin‐level assessments
            Region    in place, Tcf  recoverable, Tcf  RF, %
                                                                 for seven gas shales in six North American basins. He esti-
            NAM          5,314          1208          23         mated that the resource endowment in these six basins is 4789
            AAO          7,042          1800          26         Tcf. In the same year, DOE (2009) estimated the OGIP in
            LAM          6,935          1906          27         Antrim and New Albany shales at 76 and 160 Tcf, respec-
            AFR          3,962          1024          26         tively. Formations prospective for shale in the  Western
            EUP          2,587           624          24         Canadian Sedimentary Basin potentially contain 1380–1490
            World       25,840          6562          25
                                                                 Tcf of shale gas (EIA, 2011a; Kuuskraa and Stevens, 2009).


            TAbLE 14.5  North American basins assessed
            No.     Nomenclature    Full name                No.     Nomenclature    Full name
            1       APPB            Appalachian Basin          9     ILLB            Illinois Basin
            2       ANAB            Anadarko Basin           10      LMS             Louisiana Mississippi Salt
            3       ARKB            Arkoma Basin             11      MICB            Michigan Basin
            4       BWB             Black Warrior Basin      12      PERB            Permian Basin
            5       DENB            Denver Basin             13      SJB             San Juan Basin
            6       ETB             East Texas Basin         14      WGC             Western Gulf Coast
            7       FWB             Fort Worth Basin         15      WILB            Williston Basin
            8       GGRB            Greater Green River Basin  16    WCSB            Western Canadian Sedimentary Basin


            TAbLE 14.6  Comparison of original shale gas OGIP assessments by basin, in Tcf
                        Smead and         Kuuskraa and   DOE
            Basins      Pickering (2008)  Stevens (2009)  (2009)              Others               Dong et al. (2012)
            ANAB                              199                                                  199
            APPB                             2100         1500     225248     Williams (2006)      1725–2348
            ARKB              23              320          52                                      75–343
            BWB               23                                                                   23
            DENB              13                                                                   13
            ETB‐LMS                           790          717                                     717–790
            FWB              168              250          327                                     168–327
            GGRB             265                                                                   265
            ILLB                                           160                                     160
            MICB                                           76                                      76
            PERB             265                                                                   265
            SJB               61                                      97      Petzet (2007)        61–97
            WGC                                                       950     Hill and Nelson (2000)  950
            WILB              15                                                                   15
            WCSB                             1380                    1490     EIA (2011a)          1380–1490
            TOTAL            833             4789         2832       4774     EIA (2011a)          4774–7341
   320   321   322   323   324   325   326   327   328   329   330