
Page 326 - Fundamentals of Gas Shale Reservoirs
P. 326
306 RESOURCE ESTIMATION FOR SHALE GAS RESERVOIRS
Table 14.6 presents the shale gas resource estimates com- endowment will likely continue, driven by more intense
piled for the 16 basins used in the Dong et al. (2012) study. development of existing shale gas plays as well as the dis-
If only one assessment was available for a particular basin, covery of new plays in North America. Dong et al. (2012)
we used that assessment in our study. If multiple assess- suggest that the range underestimates the uncertainty, so
ments were available for a basin, we used the minimum and they arbitrarily decided that it represents a 50% confidence
maximum value among these assessments to generate a GIP interval. In other words, they suggest that there is a 25%
range. Shale OGIP in the Marcellus Shale in the Appalachian probability that the volume of shale‐gas OGIP is less than or
basin is estimated at 1500 Tcf by DOE (2009) and 2100 Tcf equal to 4774 Tcf (P25), and a 75% probability that the
by Kuuskraa (2009). Williams (2006) reported shale OIGP volume is less than or equal to 7341 Tcf (P75). A lognormal
in the Ohio Shale in the Appalachian basin at 225–248 Tcf. distribution was fit to these two points, which yielded a mean
The resulting shale OGIP of 1725–2348 Tcf in Appalachian of 6 260 Tcf and standard deviation of 2040 Tcf (Fig. 14.5).
basin was adopted in the Dong et al. (2012) study. In addition, It is clear that there are abundant volumes of natural gas
shale OGIP in the Fayetteville Shale in the Arkoma basin is in North America. The question now requiring an answer
estimated at 52 Tcf by DOE (2009) and 320 Tcf by Kuuskraa is this: What portion of the gas resource is technically and
(2009). Shale OIGP in the Woodford Shale in the Arkoma economically recoverable? The objective of Dong et al.’s
basin is reported as 23 Tcf (Smead and Pickering, 2008). (2013) work was to develop the data sets, methodology,
The resulting shale OGIP of 75–343 Tcf in Arkoma basin and tools to determine values of OGIP, TRRs, RF, and
was used in the Dong et al. (2012) study. economic viability in highly uncertain and risky shale gas
The total volume of original shale gas in place for the 16 reservoirs.
North American basins was estimated to be 4774–7341 Tcf
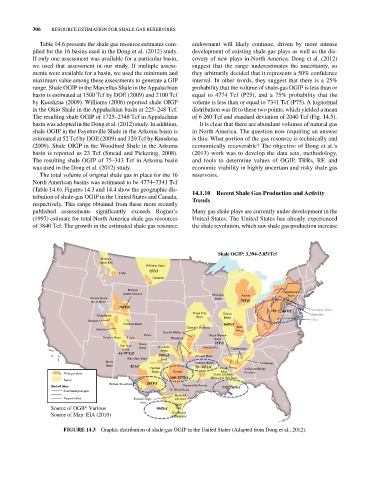
(Table 14.6). Figures 14.3 and 14.4 show the geographic dis- 14.1.10 Recent Shale Gas Production and Activity
tribution of shale‐gas OGIP in the United States and Canada, Trends
respectively. This range obtained from these more recently
published assessments significantly exceeds Rogner’s Many gas shale plays are currently under development in the
(1997) estimate for total North America shale gas resources United States. The United States has already experienced
of 3840 Tcf. The growth in the estimated shale gas resource the shale revolution, which saw shale gas production increase
Shale OGIP: 3,394~5,851Tcf
Montana
Thrust Belt
Williston Basin
15Tcf
Cody
Gammon
Hilliard
Baxter-Mancos Michigan Antrim Appalachian
Basin
Greater Green Basin
River Basin 76Tcf
265Tcf
1,725–2,348Tcf Devonian (Ohio)
Forest City Illinois
Uinta Basin Basin Basin Marcellus
Mancos Utica
Piceance Basin 160Tcf
Cherokee Platform New
Hermosa
Excello-Mulky Albany
Pierre Black Warrior
Paradox Basin Lewis Woodford Basin
23Tcf
San Juan Raton Anadarko Fayetteville
Basin Basin Basin Chattanooga
61~97 Tcf
199Tcf Arkoma Basin
Palo Duro Basin Bend
Marfa Ardmore Basin Conasauga
Basin 42Tcf Permian 75~343Tcf Floyd- Valley and Ridge
Basin Barnett Neal Province
Shale gas plays Texas-Louisiana-
168~327Tcf Mississippi Salt Basin
Basins
Barnett-Woodford 265Tcf
Stacked plays Haynesville-Bossier 717–790Tcf
Shallowest/youngest Ft. Worth Basin
Maverick
Deepest/oldest Pearsall-Eagle sub-basin
Ford Eagle
Source of OGIP: Various 950Tcf Ford
Rio Grande
Source of Map: EIA (2010) Embayment
FIGURE 14.3 Graphic distribution of shale‐gas OGIP in the United States (Adapted from Dong et al., 2012).