
Page 327 - Fundamentals of Gas Shale Reservoirs
P. 327
INTRODUCTION 307
Shale gas OGIP:1380Tcf
830
Tcf
B W
250
Tcf 300
Tcf
T
FIGURE 14.4 Graphic distribution of shale‐gas OGIP in Canada (Adapted from Dong et al., 2012). Source: PTAC (2006).
100
Lognormal (6260,2040)
80
@75%: 7341 Tcf
@25%: 4774 Tcf
60
Percentile 40
20
0
0 2,000 4,000 6,000 8,000 10,000 12,000 14,000 16,000
Shale gas OGIP (Tcf)
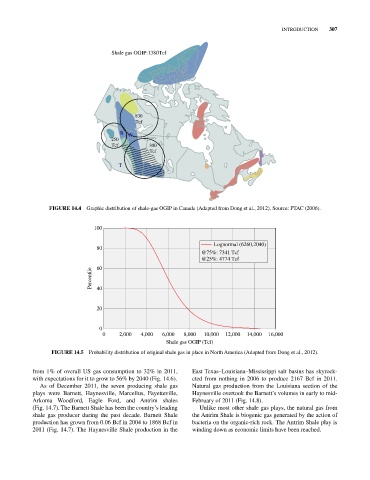
FIGURE 14.5 Probability distribution of original shale gas in place in North America (Adapted from Dong et al., 2012).
from 1% of overall US gas consumption to 32% in 2011, East Texas–Louisiana–Mississippi salt basins has skyrock-
with expectations for it to grow to 56% by 2040 (Fig. 14.6). eted from nothing in 2006 to produce 2167 Bcf in 2011.
As of December 2011, the seven producing shale gas Natural gas production from the Louisiana section of the
plays were Barnett, Haynesville, Marcellus, Fayetteville, Haynesville overtook the Barnett’s volumes in early to mid‐
Arkoma Woodford, Eagle Ford, and Antrim shales February of 2011 (Fig. 14.8).
(Fig. 14.7). The Barnett Shale has been the country’s leading Unlike most other shale gas plays, the natural gas from
shale gas producer during the past decade. Barnett Shale the Antrim Shale is biogenic gas generated by the action of
production has grown from 0.06 Bcf in 2004 to 1868 Bcf in bacteria on the organic‐rich rock. The Antrim Shale play is
2011 (Fig. 14.7). The Haynesville Shale production in the winding down as economic limits have been reached.