
Page 329 - Fundamentals of Gas Shale Reservoirs
P. 329
METHODOLOGY 309
6.0
Barnett Shale
5.5
Gas production (Bcf/d) 4.5 Haynesville Shale
5.0
4.0
3.5
3.0
10/19/2010 11/18/2010 12/18/2010 1/17/2011 2/16/2011 3/18/2011
Date
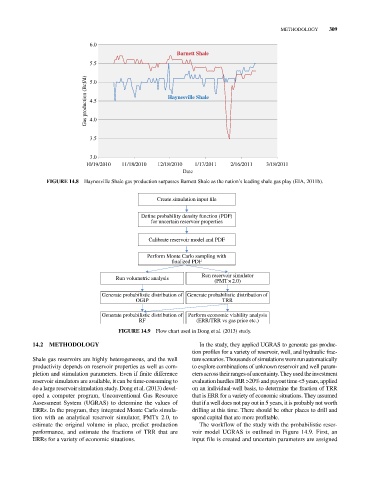
FIGURE 14.8 Haynesville Shale gas production surpasses Barnett Shale as the nation’s leading shale gas play (EIA, 2011b).
Create simulation input le
De ne probability density function (PDF)
for uncertain reservoir properties
Calibrate reservoir model and PDF
Perform Monte Carlo sampling with
nalized PDF
Run reservoir simulator
Run volumetric analysis (PMT×2.0)
Generate probabilistic distribution of Generate probabilistic distribution of
OGIP TRR
Generate probabilistic distribution of Perform economic viability analysis
RF (ERR/TRR vs gas price etc.)
FIGURE 14.9 Flow chart used in Dong et al. (2013) study.
14.2 METHODOLOGY In the study, they applied UGRAS to generate gas produc-
tion profiles for a variety of reservoir, well, and hydraulic frac-
Shale gas reservoirs are highly heterogeneous, and the well ture scenarios. Thousands of simulations were run automatically
productivity depends on reservoir properties as well as com- to explore combinations of unknown reservoir and well param-
pletion and stimulation parameters. Even if finite difference eters across their ranges of uncertainty. They used the investment
reservoir simulators are available, it can be time‐consuming to evaluation hurdles IRR >20% and payout time <5 years, applied
do a large reservoir simulation study. Dong et al. (2013) devel- on an individual‐well basis, to determine the fraction of TRR
oped a computer program, Unconventional Gas Resource that is ERR for a variety of economic situations. They assumed
Assessment System (UGRAS) to determine the values of that if a well does not pay out in 5 years, it is probably not worth
ERRs. In the program, they integrated Monte Carlo simula- drilling at this time. There should be other places to drill and
tion with an analytical reservoir simulator, PMTx 2.0, to spend capital that are more profitable.
estimate the original volume in place, predict production The workflow of the study with the probabilistic reser-
performance, and estimate the fractions of TRR that are voir model UGRAS is outlined in Figure 14.9. First, an
ERRs for a variety of economic situations. input file is created and uncertain parameters are assigned