
Page 335 - Fundamentals of Gas Shale Reservoirs
P. 335
1.E+06
Field data
Simulated by UGRAS (P10)
Simulated by UGRAS (mean)
Simulated by UGRAS (P50)
Production (Mcf/month) 1.E+04
Simulated by UGRAS (P90)
1.E+05
1.E+03
0 50 100 150 200 250 300
Month
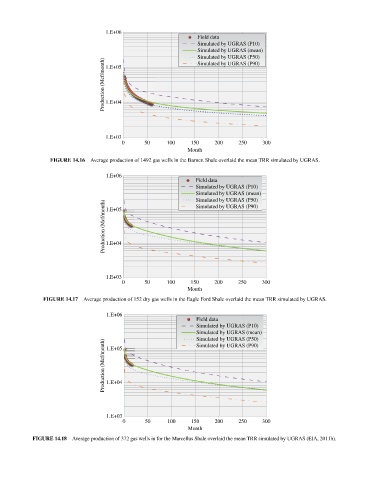
FIGURE 14.16 Average production of 1492 gas wells in the Barnett Shale overlaid the mean TRR simulated by UGRAS.
1.E+06
Field data
Simulated by UGRAS (P10)
Simulated by UGRAS (mean)
Simulated by UGRAS (P50)
Production (Mcf/month) 1.E+04
Simulated by UGRAS (P90)
1.E+05
1.E+03
0 50 100 150 200 250 300
Month
FIGURE 14.17 Average production of 152 dry gas wells in the Eagle Ford Shale overlaid the mean TRR simulated by UGRAS.
1.E+06
Field data
Simulated by UGRAS (P10)
Simulated by UGRAS (mean)
Simulated by UGRAS (P50)
Production (Mcf/month) 1.E+04
Simulated by UGRAS (P90)
1.E+05
1.E+03
0 50 100 150 200 250 300
Month
FIGURE 14.18 Average production of 372 gas wells in for the Marcellus Shale overlaid the mean TRR simulated by UGRAS (EIA, 2011b).