
Page 16 - Fundamentals of Light Microscopy and Electronic Imaging
P. 16
Color Plates
Thickness (µm)
10 20 30 40
100 0.002
200 0.004
300 0.006
400 0.008
500 0.010
600 0.012
700
0.014
Relative phase retardation (nm) 1000 0.016 Birefringence (∆n)
800
0.018
900
0.020
1100
0.024
1200 0.022
1300 0.026
1400 0.028
1500 0.030
1600 0.032
1700 0.034
1800 0.036
0.150
0.100
0.090
0.060
0.070
0.080
0.300
0.200
Birefringence (∆n) 0.050 0.046 0.044 0.042 0.040 0.038
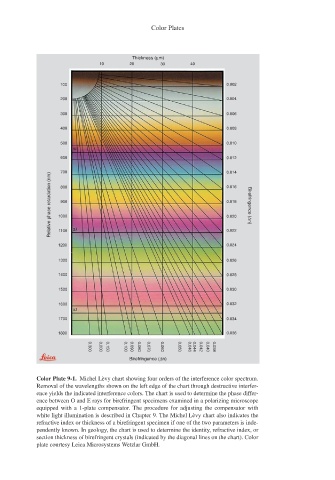
Color Plate 9-1. Michel Lèvy chart showing four orders of the interference color spectrum.
Removal of the wavelengths shown on the left edge of the chart through destructive interfer-
ence yields the indicated interference colors. The chart is used to determine the phase differ-
ence between O and E rays for birefringent specimens examined in a polarizing microscope
equipped with a 1-plate compensator. The procedure for adjusting the compensator with
white light illumination is described in Chapter 9. The Michel Lèvy chart also indicates the
refractive index or thickness of a birefringent specimen if one of the two parameters is inde-
pendently known. In geology, the chart is used to determine the identity, refractive index, or
section thickness of birefringent crystals (indicated by the diagonal lines on the chart). Color
plate courtesy Leica Microsystems Wetzlar GmbH.