
Page 17 - Fundamentals of Light Microscopy and Electronic Imaging
P. 17
Color Plates
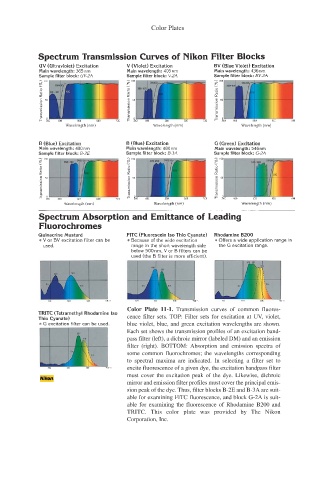
Color Plate 11-1. Transmission curves of common fluores-
cence filter sets. TOP: Filter sets for excitation at UV, violet,
blue violet, blue, and green excitation wavelengths are shown.
Each set shows the transmission profiles of an excitation band-
pass filter (left), a dichroic mirror (labeled DM) and an emission
filter (right). BOTTOM: Absorption and emission spectra of
some common fluorochromes; the wavelengths corresponding
to spectral maxima are indicated. In selecting a filter set to
excite fluorescence of a given dye, the excitation bandpass filter
must cover the excitation peak of the dye. Likewise, dichroic
mirror and emission filter profiles must cover the principal emis-
sion peak of the dye. Thus, filter blocks B-2E and B-3A are suit-
able for examining FITC fluorescence, and block G-2A is suit-
able for examining the fluorescence of Rhodamine B200 and
TRITC. This color plate was provided by The Nikon
Corporation, Inc.