
Page 199 - Fundamentals of Radar Signal Processing
P. 199
(3.19)
where ω is the Doppler frequency shift in normalized radian frequency units.
D
The DTFT of y [m] is
s
(3.20)
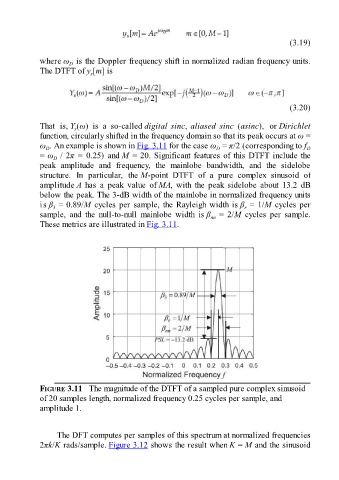
That is, Y (ω) is a so-called digital sinc, aliased sinc (asinc), or Dirichlet
s
function, circularly shifted in the frequency domain so that its peak occurs at ω =
ω . An example is shown in Fig. 3.11 for the case ω = π/2 (corresponding to f D
D
D
= ω / 2π = 0.25) and M = 20. Significant features of this DTFT include the
D
peak amplitude and frequency, the mainlobe bandwidth, and the sidelobe
structure. In particular, the M-point DTFT of a pure complex sinusoid of
amplitude A has a peak value of MA, with the peak sidelobe about 13.2 dB
below the peak. The 3-dB width of the mainlobe in normalized frequency units
is β = 0.89/M cycles per sample, the Rayleigh width is β = 1/M cycles per
3
r
sample, and the null-to-null mainlobe width is β = 2/M cycles per sample.
nn
These metrics are illustrated in Fig. 3.11.
FIGURE 3.11 The magnitude of the DTFT of a sampled pure complex sinusoid
of 20 samples length, normalized frequency 0.25 cycles per sample, and
amplitude 1.
The DFT computes per samples of this spectrum at normalized frequencies
2πk/K rads/sample. Figure 3.12 shows the result when K = M and the sinusoid