
Page 200 - Fundamentals of Radar Signal Processing
P. 200
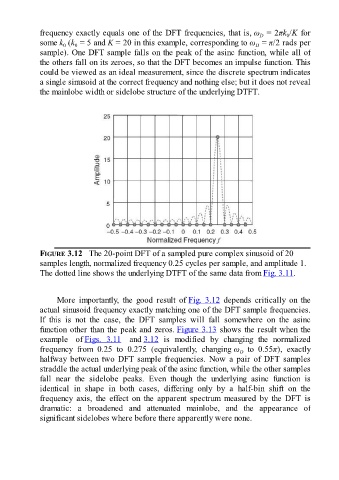
frequency exactly equals one of the DFT frequencies, that is, ω  = 2πk /K for
                                                                                                      0
                                                                                            D
               some k  (k  = 5 and K = 20 in this example, corresponding to ω  = π/2 rads per
                       0
                           0
                                                                                           D
               sample). One DFT sample falls on the peak of the asinc function, while all of
               the others fall on its zeroes, so that the DFT becomes an impulse function. This
               could be viewed as an ideal measurement, since the discrete spectrum indicates
               a single sinusoid at the correct frequency and nothing else; but it does not reveal
               the mainlobe width or sidelobe structure of the underlying DTFT.


               FIGURE 3.12   The 20-point DFT of a sampled pure complex sinusoid of 20
               samples length, normalized frequency 0.25 cycles per sample, and amplitude 1.
               The dotted line shows the underlying DTFT of the same data from Fig. 3.11.


                     More  importantly,  the  good  result  of Fig. 3.12  depends  critically  on  the
               actual sinusoid frequency exactly matching one of the DFT sample frequencies.
               If  this  is  not  the  case,  the  DFT  samples  will  fall  somewhere  on  the  asinc

               function other than the peak and zeros. Figure 3.13 shows the result when the
               example  of Figs.  3.11  and 3.12  is  modified  by  changing  the  normalized
               frequency  from  0.25  to  0.275  (equivalently,  changing ω   to  0.55π),  exactly
                                                                                     D
               halfway  between  two  DFT  sample  frequencies.  Now  a  pair  of  DFT  samples
               straddle the actual underlying peak of the asinc function, while the other samples
               fall  near  the  sidelobe  peaks.  Even  though  the  underlying  asinc  function  is
               identical  in  shape  in  both  cases,  differing  only  by  a  half-bin  shift  on  the

               frequency  axis,  the  effect  on  the  apparent  spectrum  measured  by  the  DFT  is
               dramatic:  a  broadened  and  attenuated  mainlobe,  and  the  appearance  of
               significant sidelobes where before there apparently were none.