
Page 387 - Fundamentals of Radar Signal Processing
P. 387
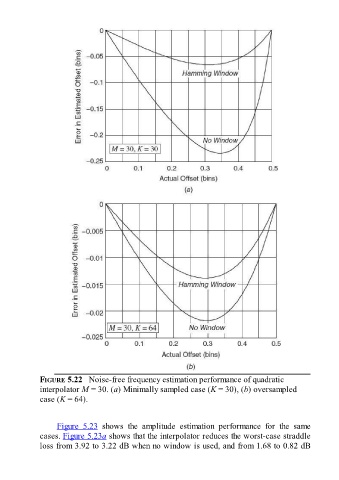
FIGURE 5.22   Noise-free frequency estimation performance of quadratic
               interpolator M = 30. (a) Minimally sampled case (K = 30), (b) oversampled
               case (K = 64).


                     Figure  5.23  shows  the  amplitude  estimation  performance  for  the  same
               cases. Figure 5.23a shows that the interpolator reduces the worst-case straddle
               loss from 3.92 to 3.22 dB when no window is used, and from 1.68 to 0.82 dB